RESEARCH ARTICLE
Optimization of Bifonazole-Loaded Nisomal Formulation Using Plackett-Burman Design and 23 Factorial Design
Harshal Ashok Pawar*, Vibhavari Bhaskar Attarde, Gide Parag Subhash
Article Information

Identifiers and Pagination:
Year: 2016Volume: 3
First Page: 31
Last Page: 48
Publisher Id: PHARMSCI-3-31
DOI: 10.2174/1874844901603010031
Article History:
Received Date: 3/4/2015Revision Received Date: 5/4/2016
Acceptance Date: 05/04/2016
Electronic publication date: 06/05/2016
Collection year: 2016
open-access license: This is an open access article licensed under the terms of the Creative Commons Attribution-Non-Commercial 4.0 International Public License (CC BY-NC 4.0) (https://creativecommons.org/licenses/by-nc/4.0/legalcode), which permits unrestricted, non-commercial use, distribution and reproduction in any medium, provided the work is properly cited.
Abstract
Background:
Bifonazole is an imidazole antifungal drug. It is highly lipophilic drug with a very short half-life and is minimally absorbed following dermal application. Niosomes are excellent candidate as potential drug delivery system because of their improved drug solubilization, enhanced penetration power, long shelf life and ease of preparation and administration.
Objective:
The aim of the study was to enhance permeability of bifonazole by incorporating it into niosomes and formulating its gel formulation.
Method:
Niosomes were prepared by thin film hydration method. The statistical approach was used to optimize the parameters for niosome formation. The process parameters among six factors influencing in vitro diffusion study were identified using plackett burman design. The Plackett–Burnan design described in this study was applied for the identification of the significant factors and 23 factorial design was used to obtain optimized batch. The prepared niosomes were evaluated for various parameters such as vesicular size, drug entrapment, surface morphology, drug release characteristics, ex vivo deposition and stability.
Results:
Niosomal gel showed significantly enhanced drug permeation through the skin as compared to the marketed formulation. The optimized niosomal gel formulation also showed drug release in a controlled manner. The stability study at two different temperatures (25 ± 2°C and and 5 ± 3 °C) confirmed that the optimized formulation is stable even at the end of 3 months.
Conclusion:
It has been concluded that niosomal gel is an efficient carrier for the delivery of bifonazole with improved permeability.
INTRODUCTION
The vesicular systems are highly ordered assemblies of one or several concentric lipid bilayer formed, when certain amphiphillic building blocks are confronted with water. Various vesicular systems are available to improve the thera-peutic index of both existing and new drug molecules by encapsulating an active ingredient in vesicular structure such as liposomes, niosomes, sphingosomes, ethosomes, transferosomes and pharmacosomes [1].
Niosomes are microscopic lamellar structures and hydrated vesicular systems containing nonionic surfactants along with cholesterol or other lipids delivering drug to targeted site which are non toxic, requiring less production cost, stable over a longer period of time in different conditions [2]. Niosome, a nonionic surfactant vesicular formulation, has been explored broadly for topical application to enhance skin penetration as well as to improve skin retention of drugs [1]. Many factors affect niosome formation such as the method of manufacture, nature of surfactant and drug, temperature at which the lipids are hydrated and the critical packing parameter [2]. Drug deposition, vesicle size and entrapment efficiency are the key parameters involved in formulation of topical niosomes [3].
Superficial fungal infections (dermatomycoses) of the skin are among the most common diseases observed in our daily practice and occur throughout the world. These infections are contagious caused by either a human (anthropophilic) or animal (zoophile) species of dermatophyte fungi. Tinea pedis (athlete's foot or ringworm) is the most common dermatophytosis and may affect up to 70 % of adults worldwide. Most cases of tinea pedis respond to topical antifungal agents. Clinical efficacy of topical antifungal therapy depends on the drug ability to penetrate into the stratum corneum (SC) and the duration of treatment [4].
Bifonazole is an imidazole antifungal drug which has been used in many skin and nail infections caused by fungi. It is highly lipophilic drug with a very short half-life (1-2 hr) and is minimally absorbed following dermal application (0.6 % of an applied dose). Niosomes are excellent candidate as potential drug delivery system because of their improved drug solubilization, enhanced penetration power, long shelf life and ease of preparation and administration [5]. Experimental design is a powerful tool for optimizing different non-homogeneous parameters and conditions. Plackett-Burman designs are ideal for screening purpose in systems where it is desired to a few main factors affecting the outcome and where interactions are not significant. Plackett–Burman enables randomizing different variables aiming to get the best conditions where each variable coordinates with other variables to give the best expected results [6]. Plackett-Burman designs utilise two levels for each factor, the higher level being denoted “+” and the lower “-” as usual. In the present study, the experimental design can be used in order to derive valid and robust statistical significance tests for the examined factors with a minimum number of experiments. More specifically, with the Plackett-Burman designs one will have an estimate of the factors main effects only and no other information concerning higher order interactions [7]. The objective of present research work was to develop, optimize and evaluate bifonazole containing niosomal gel with improved permeability using Plackett-Burman statistical design and 23 factorial design.
2. MATERIALS AND METHOD
Bifonazole was obtained as gift sample from wexford laboratories, Banglore (India). Cholesterol AR was obtained from Himedia Laboratories, Mumbai (India). Sorbitan monostearate (span 60), Polysorbate 80 (tween 80), Ethanol LR Grade, Methanol LR Grade, Potassium Dihydrogen Orthophosphate LR Grade and Sodium Hydroxide Pellets LR Grade were purchased from Molychem, Mumbai (India). Cellophane Membrane was purchased from Himedia Laboratories Pvt. Ltd., Mumbai (India). Mycospor (Bifonazole cream IP) manufactured by Bayer Pharmaceuticals Pvt. Ltd was purchased from local market (Batch no. K12306).
3. FORMULATION DEVELOPMENT
3.1. Stability Profile of Bifonazole in Various Buffers
Stability of bifonazole was studied in various buffers. Buffers were prepared according to USP. 10 ppm solution of bifonazole in specific buffer was maintained at 37°C for 24 hr and upto 6th hr the drug content was determined spectrophotometrically at interval of 1 hr. At the end of 24 hr again the drug content was determined.
3.2. Optimization of Process Parameters
The software used here for the optimization of process parameters for niosome and niosomal gel formulation was design expert 7.0.0. Screening designs are used to screen important factors during method optimization. Usually, two-level screening designs, such as fractional factorial and Plackett-Burman designs, are applied. These designs allow the effects of a relatively high number of factors, in a relatively small and feasible number of experiments, to be evaluated. Therefore, these designs are extremely useful in preliminary studies where the aim is to identify formulation variables that can be fixed and using those variables one can optimize batch [8] .
In this study, Plackett-Burman(PB) design was used to identify the significant process variables. A screening of the effects of six independent variables namely, millimole of surfactant and cholesterol, surfactant: cholesterol ratio, time of hydration, pH of hydration medium, hydration temperature and speed of rotation was carried out. The high and low levels for independent variables were selected based on extensive literature review and preliminary trials. Niosomes were prepared by thin film hydration method. The different levels for the independent variables for the 12 run of Plackett-Burman designs are given in Table 1. All the variables were denoted as numerical factors and investigated at two widely spaced intervals designated as -1 (low level) and +1 (high level).
Factors and factor levels investigated in plackett burman experimental design.
| Factors | Levels | |
|---|---|---|
| -1 | +1 | |
| (A) Millimole(mM) of surfactant and cholesterol | 10 | 30 |
| (B) Surfactant:cholesterol ratio | 1:1 | 7:1 |
| (C) Time of hydration (hr) | 0.5 | 1 |
| (D) pH of hydration medium | 6.8 | 7.4 |
| (E) Hydration temperature (°C) | 55 | 65 |
| (F) Speed of rotation (rpm) | 60 | 80 |
3.3. Preparation of Niosomes
Niosomes were prepared by thin film hydration method. Surfactant (Span 60) and cholesterol were dissolved in ethanol in a round bottom flask. Drug was dissolved separately in methanol and mixed with above solvent. Using rotary evaporator, the organic solvent was removed and a thin film layer of solid mixture was deposited on the wall of the flask. The film was rehydrated with appropriate phosphate buffer mentioned in Table 1 with gentle agitation resulted in formation of multilamellar niosomes [9]. The various conditions used for formation of niosomes are mentioned in Tables 1, 2.
3.4. Preparation of Niosomal Gel
Weighed amount of Carbopol 940 (1%) was sprinkled onto the niosomal dispersion containing drug and allowed to hydrate for 1-2 hours. Propylene Glycol (3%) and oleic acid (3%) were added subsequently to the aqueous dispersion with continuous stirring [3]. Methyl paraben (0.1%) was used as preservative. Niosomal gel was prepared by adjusting pH of gel between pH 6 -7 using triethanolamine.
3.5. Optimization of Formulation Using 23 Factorial Design
From Plackett Burman design, the most significant factors were identified and the factorial design 2 level 3 factor was designed to optimize the formulation. Millimole of surfactant and cholesterol (X1), time of hydration(X2), hydration temperature (X3) were selected as independent variables and in vitro drug release from formulation was selected as dependent variable. The different levels for the independent variables for the 23 factorial design are given in Table 2. Table 3 shows 23 factorial design for optimization of developed formulation.
Factors and factor levels investigated in 23 factorial design.
| Factors | Levels | |
|---|---|---|
| -1 | +1 | |
| (X1) Millimole (mM) of surfactant and cholesterol | 10 | 200 |
| (X2) Time of hydration (min) | 15 | 45 |
| (X3) Hydration temperature (°C) | 55 | 60 |
23 factorial design for optimization of developed formulation.
| Formulation no. | X1 | X2 | X3 | |
|---|---|---|---|---|
| P1 | 10 | 15 | 55 | |
| P2 | 200 | 15 | 55 | |
| P3 | 10 | 45 | 55 | |
| P4 | 200 | 45 | 55 | |
| P5 | 10 | 15 | 60 | |
| P6 | 200 | 15 | 60 | |
| P7 | 10 | 45 | 60 | |
| P8 | 200 | 45 | 60 | |
4. CHARACTERIZATION OF BIFONAZOLE NIOSOMES AND NIOSOMAL GEL
4.1. Drug-Excipient Interaction Study
4.1.1. Fourier Transform Infrared (FTIR) Spectroscopy
The pure drug (Bifonazole) and its mixture with cholesterol and span 60 were mixed separately, with infrared (IR) grade potassium bromide (KBr) in the ratio of 1:100. Corresponding pellets were prepared by applying 6 metric ton pressure with a hydraulic press. The pellets were scanned in an inert atmosphere over a wave number range of 4000 – 400 cm-1 using FTIR instrument (Shimadzu IR Infinity-1, Japan).
4.1.2. Differential Scanning Calorimetry (DSC)
DSC measurement of bifonazole, its physical mixture with excipients and final formulation were performed with an instrument (Exstar SII, 6220 , Japan) for the measurement of thermotropic transition. Empty aluminium pans were used as reference and samples were carefully placed in another aluminium pan. The measurement was done in an inert atmosphere within the temperature range of 30ᵒC to 305ᵒC at rate of 10ᵒC per min.
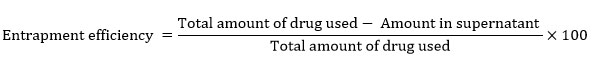
4.2. Entrapment Efficiency Determination
The prepared dispersion was centrifuged at 15000 rpm in refrigerated centrifuge (Remi CPR 24, Mumbai) for 30 min in order to separate entrapped drug. Further centrifuagtion supernatant was separated. The pellet obtained at bottom after centrifugation was washed with phosphate buffer pH 6.8. After further centrifugation, the wash obtained was mixed with former supernatant. The mixture was filtered and sufficiently diluted with methanol to determine the concentration of unentrapped drug spectrophotometrically at 254 nm using methanol as blank [10]. The entrapment efficiency was calculated using the following equation [11].
 |
4.3. Drug Content
The drug content was determined by dissolving the 0.5 gm of gel containing dispersed niosomes in methanol to break the niosomal structure and release the entrapped drug. Subsequently, the solution was filtered using the Whatmann filter paper no.42. Appropriate dilutions were done and absorbances were measured spectrophotometrically at 254 nm using methanol as blank [12]. The drug content was found out from calibration curve.
4.4. Microscopic Examination of Vesicles
Small amounts of niosomal dispersion were spread on a glass slide and examined for the vesicles structure and the presence of insoluble drug crystals. Photomicrographs were taken for niosomes using Future Winjoe Projection Microscope (MEM 1300, Chin) using 10x magnification power.
4.5. Size Distribution Study and Zeta Potential Measurement
Size distribution and zeta potential of the optimized formulation was determined using a Zetasizer Nano ZS instrument and the results were analyzed using DTS software (Malvern Instruments Limited, Malvern, UK).
4.6. Scanning Electron Microscopy
Morphology of niosomes was studied with the help of a JSM electron microscope (JSM-7600F). Niosome samples were reconstituted with deionized water and were spread on to a carbon tape over a stub. The samples were vacuum dried and examined under the electron microscope using 100,000 X magnification.
4.7. Viscosity of Niosomal Gel
Viscosity of niosomal gel was measured using Brookfield viscometer with spindle no. 7 in 25 ml capacity beaker at room temperature. Spindle was lowered into beaker containing gel and rotated at speed of 100 rpm. At each speed the corresponding dial reading on the viscometer was recorded. Direct multiplication of the dial reading with the factors gave the viscosity in centipoises [13].
4.8. Spreadability of Niosomal gel
Spreadability is one of the important characteristics of any topical preparation as far as patient compliance is concerned. About 2 gm of gel was placed between the two glass slides onto which weights were allowed to rest. The top slide was then subjected to pull of 50 gm. The time in seconds required for the top slide to travel 30 cm distance was noted3.
4.9. Comparative Study of Optimized Niosomal Gel with Marketed Formulation
4.9.1. In vitro Drug Release Study
In vitro drugrelease studies on niosomal gel were performed using Franz-diffusion cell. The dialysis cellophane membrane was mounted between the donor and receptor compartment. Dialysis membrane was soaked in phosphate buffer 6.8 containing tween 80 (1%) for overnight before use. A 0.2 gm of niosomal gel was placed on one side of the dialysis membrane. Phosphate buffer pH 6.8 containing tween 80 (1%) was taken in receptor compartment. Heat is supplied using a thermostat with magnetic stirrer. The diffusion cell was placed over a magnetic stirrer at 150 rpm and temperature was maintained at 37 ± 1ᵒC. Aliquots (1 ml) were withdrawn at predetermined time interval of 30mins, 1hr, 2hr, 3hr, 4hr, 5hr, 6hr, 7hr and same volume is replaced with fresh buffer. The sink condition was maintained throughout the experiment [14]. The aliquotes were sufficiently diluted with methanol and evaluated spectro-photometrically at 254 nm using methanol as blank.
In vitro drugrelease study was conducted on optimized formulation as well as marketed formulation for 7 hr. The percentage cumulative amount of drug released was noted down for both the formulations.
4.9.2. Release Kinetics
To study the release kinetics, data obtained from in vitro permeation studies were fitted in various kinetic models viz. zero order as cumulative percent of drug permeated versus time, first order as log cumulative percentage of drug remaining versus time and Higuchi’s model as cumulative percent drug permeated versus square root of time. To determine the mechanism of drug release, the data obtained were fitted into Korsmeyer and Peppas equation as log cumulative percentage of drug released versus log time, and the exponent ‘n’ was calculated from slope of the straight line. For slab matrix, if n < 0.5 - quasi-Fickian Diffusion, if exponent is 0.5, then diffusion mechanism is fickian; if 0.5 < n < 1.0, mechanism is non- fickian, n = 1 to Case II (relaxational) transport, and n > 1 to super case II transport [17,18].
4.9.3. Ex-vivo Skin Permeation Study
In the present study, hairless wistar rat abdominal skin was used. Hairs were removed with animal hair clipper, subcutaneous tissue was surgically removed and dermis side was wiped with isopropyl alcohol to remove residual adhering fat. The skin was washed with phosphate buffer pH 7.4 and used within 24 hr. Ex-vivo release studies on niosomal gel were performed using Franz-diffusion cell. The rat abdominal skin was mounted between the donor and receptor compartment. The same procedure was followed as discussed under in vitro drug release study .
The data was analyzed to evaluate various permeability parameters [19].
4.9.3.1. Steady-State Flux
Flux is defined as the rate of diffusion or transport of a substance across a permeable membrane. After drug permeation reached steady state, the steady-state flux was calculated using the following equation:
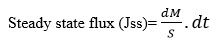 |
where dМ is the amount of drug that permeates through a unit cross section area and Ѕ is per unit time, t. The slope of the steady-state portion of the permeation curve created by plotting the cumulative amount of drug, permeated in micrograms versus time in hours, is the flux.
4.9.3.2. Permeability Coefficient
The permeability coefficient through the membrane (Κр) was determined according to the following equation:
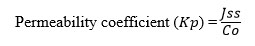 |
Where, Н is the thickness of membrane and C0 is the initial drug concentration.
4.9.3.3. Enhancement Ratio
This factor was calculated to find the relative enhancement in the flux of formulations with respect to the reference enhancement ratio.The enhancement ratio was estimated according to the following equation:
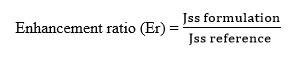 |
4.9.4. Deposition Study
For determination of drug deposited in the skin, cell was dismantled after 7 hr and skin was carefully removed from the cell. Drug present on the surface of the skin was removed. After stripping the skin was cut into small pieces and drug present in the skin was extracted in methanol by sonicating it for 1 hr in bath sonicator. The drug content in the extract was estimated by using UV spectrophotometer at 254 nm3.
4.10. Stability Study
Stability studies were carried out on optimized niosomal gel containing niosomal dispersion at 5 ± 3 ᵒC and 25 ± 2ᵒC / 60 % RH ± 5 % RH for 3 months. Effects of temperature and relative humidity on physical appearance, spreadability, pH, drug content and in vitro drug release were studied on niosomal gel during stability period [20].
5. RESULTS AND DISCUSSION
5.1. Peliminary Screening
Excipient selection was made based on information available in literature, physicochemical properties of drug and compatibility studies. Cholesterol influences the physical properties and structure of niosomes possibly due to interaction with nonionic surfactants. Cholesterol imparts rigidity to vesicles, which is important under severe stress conditions. The effect of cholesterol in lipid bilayers is to modulate their cohesion, mechanical strength and permeability to water [21]. Nonionic surfactant is basic component of the niosomes. Surfactant was selected based on various properties of nonionic surfactant like hydrophilic - lipophilic balance, the chain length and size of hydrophilic head group, effect of transition temperature. Span 60 has the highest phase transition temperature (50 °C) as compared to span 40 and span 20 and hence high entrapment efficiency [22]. The length of alkyl chain of surfactant has a prominent effect on permeability of prepared niosomes. As the length of surfactant increases, entrapment efficiency increases while as length decreases entrapment efficiency decreases [15]. Hence, long chain surfactant results in high entrapment. As result span 60 was selected as surfactant because of its good entrapment efficiency andphysical mixture of bifonazole, cholesterol and HLB value.
5.2. Stability Profile of Bifonazole in Various Buffers
Stability of bifonazole drug was carried out because bifonazole drug degrades slowly in alkaline medium. Instability was identified when 10ppm of drug was maintained at 37 ± 2°C and until 6th hr at each hour till sample was detected for drug content spectrophotometrically. At the end of 24 hr the drug contents were determined.
 |
Fig. (1). Comparison of absorbances of 10ppm of various buffer solutions at 37 ± 2°C till 24 hr. |
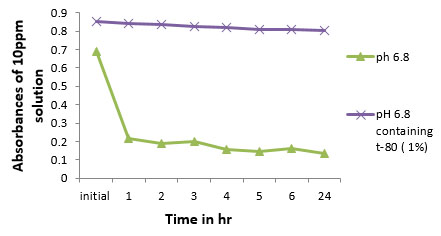 |
Fig. (2). Comparison of stability of bifonazole in pH 6.8 due to tween 80 (1%) |
As shown in Fig. (1), absorbances of 10 ppm solutions of bifonazole in various buffers at 37 ± 2ᵒC untill 24th hr decreases as pH gets increased from acidic to alkaline medium. Hence, effort has been made to stabilize the drug in buffer which was used as diffusion medium by the addition of tween 80 (1%). It has been observed that by the addition of tween 80 (1%), stability of bifonazole in pH 6.8 increases (Fig. 2).
5.3. Preformulation Study
5.3.1. Drug-Excipients Interaction Study by FTIR
The identification of drug was confirmed by comparing IR spectrum of drug with reported spectrum of Bifonazole. The IR spectra of Bifonazole showed characteristic bands (Fig. 3, Table 4) similar to that reported in literature [16].
In this study, we have initially used FTIR spectroscopy to determine any drug-excipient interaction at the level of functional groups. Spectra of pure drug bifonazole and physical mixture of bifonazole, cholesterol and span 60 compared for compatibility and all the drug peaks were identified in physical mixture (Fig. 4). The results indicated that drug and all excipients used in formulation preparation are compatible.
IR assignments for bifonazole.
| Functional group | Frequency |
|---|---|
| Aromatic C-H stretching | 3030.17 |
| Aliphatic C-H stretching | 2929.87 and 2850.79 |
| Aromatic C-C stretching | 1490.97 |
| C-H deformation | 1454.33 |
| C=N stretch | 1647.21 |
| Aromatic amine (C-N stretching) | 1357.89 |
| Aromatic substitution (C-H bending ) | 759.95 |
 |
Fig. (3). FTIR spectrum of plain bifonazole. |
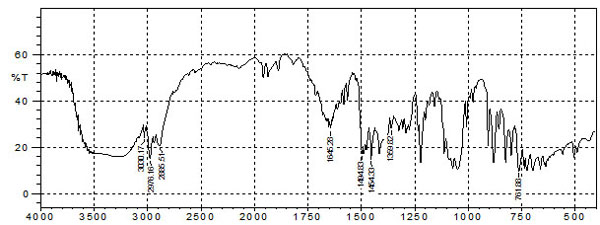 |
Fig. (4). FTIR Spectrum of bifonazole drug with all excipients. |
5.3.2. Differential Scanning Calorimetry (DSC)
The DSC was performed to study the compatibility of drug and excipients. The reported melting point range for bifonazole is 147- 151°C [23]. DSC of bifonazole drug showed sharp peak at 149.2 °C (Fig. 5a). DSC of the physical mixture of bifonazole, cholesterol and span 60 shows no interaction as DSC shows peak at 55.2° C which may be for span 60 and 148.3°C for bifonazole and cholesterol (Fig. 5b). Bifonazole loaded niosomal formulations showed broad transitions which are characteristic for lipid mixtures containing cholesterol, signifying good interaction of all components forming the bilayers of niosomes. A DSC thermogram of bifonazole loaded niosomes showed disappearance of the melting endotherm of bifonazole at 149.2°C (Fig. 5c). The absence of the melting endotherm of bifonazole and shifting and/or broadening of the endotherms of surfactant bilayers of niosomes suggest possible interaction of bifonazole with bilayer components and can account for the enhanced entrapment of bifonazole into these formulations [24]. Thus, DSC thermogram proved to be very helpful in identifying the interaction to form a drug-excipient complex which is main principle for formulation of niosomes.
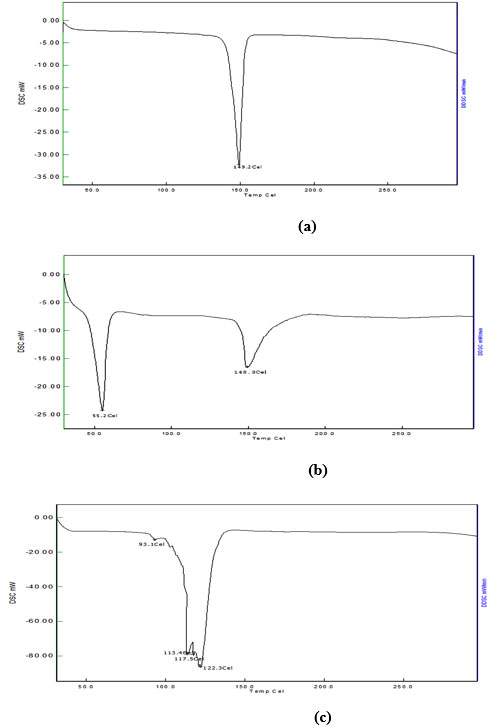 |
Fig. (5). DSC curve of (a) pure bifonazole drug, (b) physical mixture of bifonazole, cholesterol and span 60, (c) final formulation of niosomal dispersion. |
5.4. Optimization of Process Parameters
In the present study, Plackett-Burman(PB) design was used to identify the significant process variables. A screening of the effects of six independent variables namely, millimole of surfactant and cholesterol, surfactant : cholesterol ratio, time of hydration, pH of hydration medium, hydration temperature and speed of rotation were carried out. The high and low levels for independent variables were selected based on extensive literature review and preliminary trials. Niosomes were prepared by thin film hydration method. All the variables were denoted as numerical factors and investigated at two widely spaced intervals designated as -1 (low level) and +1 (high level). Table 5 shows 12 run Placket-Burman experimental design for screening significant process variables affecting niosome formulation.
Results of Placket-Burman experimental design showing observed and predicted responses of in vitro drug release study.
| Formulation No. | Factors to be screened | |||||||
|---|---|---|---|---|---|---|---|---|
| A | B | C | D | E | F | Observed response* | Predicted response | |
| F1 | 30 | 7:1 | 0.5 | 7.4 | 65 | 80 | 40.32±0.12 | 36.55 |
| F2 | 30 | 1:1 | 1 | 7.4 | 65 | 60 | 41.92±0.72 | 40.53 |
| F3 | 10 | 7:1 | 1 | 7.4 | 55 | 60 | 50.39 ±0.02 | 48.55 |
| F4 | 30 | 7:1 | 1 | 6.8 | 55 | 60 | 51.51±0.40 | 51.35 |
| F5 | 30 | 7:1 | 0.5 | 6.8 | 55 | 80 | 50.09±0.49 | 50.69 |
| F6 | 30 | 1:1 | 0.5 | 6.8 | 65 | 60 | 40.30±0.28 | 42.43 |
| F7 | 10 | 1:1 | 0.5 | 7.4 | 55 | 80 | 63.42±0.33 | 62.97 |
| F8 | 10 | 1:1 | 1 | 6.8 | 65 | 80 | 35.62±0.06 | 37.73 |
| F9 | 10 | 7:1 | 0.5 | 7.4 | 65 | 60 | 42.74±0.24 | 42.95 |
| F10 | 30 | 1:1 | 1 | 7.4 | 55 | 80 | 44.98±0.25 | 45.47 |
| F11 | 10 | 7:1 | 1 | 6.8 | 65 | 80 | 53.49±0.13 | 52.81 |
| F12 | 10 | 1:1 | 0.5 | 6.8 | 55 | 60 | 52.98±0.23 | 53.77 |
23 factorial design showing results for response in vitro drug release study.
| Formulation no. | X1 | X2 | X3 | In vitro drug release (%) * |
|---|---|---|---|---|
| P1 | 10 | 15 | 55 | 28.60±0.23 |
| P2 | 200 | 15 | 55 | 46.45±0.1 |
| P3 | 10 | 45 | 55 | 27.01±0.38 |
| P4 | 200 | 45 | 55 | 45.78±0.26 |
| P5 | 10 | 15 | 60 | 27.40± 0.13 |
| P6 | 200 | 15 | 60 | 47.17± 0.07 |
| P7 | 10 | 45 | 60 | 29.84± 0.04 |
| P8 | 200 | 45 | 60 | 49.56± 0.11 |
ANOVA for selected factorial model.
| Source | Sum of squares | df | Mean square | F value |
p- value prob>F |
|
|---|---|---|---|---|---|---|
| Model | 719.91 | 1 | 719.91 | 348.96 | < 0.0001 | significant |
| A-millimole of surfactant and cholesterol | 719.91 | 1 | 719.91 | 348.96 | < 0.0001 | |
| residual | 12.38 | 6 | 2.06 | |||
| Cor total | 732.29 | 7 |
5.5. Selection of the Optimized Batch
A 23 full factorial design was employed to evaluate the individual and combined effects of three formulation variables on niosomes performance and characteristics. In this design, three factors were evaluated, each at two levels, and experimental trials were performed at all eight possible combinations. The effects of selected independent variables viz. Millimole of surfactant and cholesterol (X1), time of hydration (X2), hydration temperature (X3) were observed on in vitro drug release study as a dependent variable. The optimized batch was selected based on comparision between results of in vitro drug release study of marketed formulation and 8 combinations from 23 factorial design. It was observed from the results that % cumulative drug release and permeation of bifonazole was superior to marketed formulation.
The respose for in vitro drug release study is shown in Table 6. Statistical analysis of the responses was performed and is represented in Table 7. The high value (0.98) of correlation coefficient (R2) for following equation indicates a good fit. The model F value of 348.96 implies that the model is significant. The values of Prob < 0.05 indicate model terms are significant. A first order polynomial equation was derived representing in vitro release study as function of the independent variables.
In vitro release study = +37.68 + 9.49 *A
Where, A : millimole of surfactant and cholesterol.
A positive sign of coefficient for Millimole (mM) of surfactant and cholesterol (A) represent favourable effect. At high level of millimole (mM) of surfactant and cholesterol there will be increase in the in vitro drug release.
5.5.1. Response Surface and Contour Plots
Contour and response surface plots were further applied to explore the effects of the independent factors on the responses. Fig. (6) represents effect of Millimole (mM) of surfactant and cholesterol (A) on in vitro drug release. As the level of Millimole (mM) of surfactant and cholesterol (A) increases from 10 mmol to 200 mmol, the invitro drug release also increases.
 |
Fig. (6). Response surface (3D) and contour plots showing the effects of the significant factors on the responses. [s:c - Surfactant: cholesterol ratio]. |
5.5.2. Pareto Charts of Effects
Pareto diagram showing effects of individual factors on in vitro drug release is depicted in Fig. (7). This graph shows the factor’s main effect estimates, rank order according to their significance plotted against the horizontal axis [7]. Hence, Pareto chart for the in vitro drug release study showed that the Millimole (mM) of surfactant and cholesterol (A) is the most significant variable having impact on drug release.
5.5.3. Effect of Cholesterol
Cholesterol alters the fluidity of chains in bilayers. Surface pressure measurements on monolayers of nonionic surfactant/cholesterol mixtures demonstrated a condensing effect of cholesterol as evidenced by the decrease in the effective area per molecule as the cholesterol content of the monolayer increased, which was attributed to the accommodation of cholesterol in the molecular cavities formed by surfactant monomers assembled into vesicles. This space-filling action of cholesterol is said to be responsible for the observed decreased permeability of cholesterol-containing membranes compared to cholesterol free membranes. Inclusion of cholesterol in phospholipid bilayers decreases the permeability of bilayers to various solutes. The entrapment efficiency, which is a measure of solute retention, was shown to be enhanced by cholesterol inclusion. Such stabilization of membranes by cholesterol inclusion is also apparent with niosomes [25]. From the results there was no significant change in entrapment of niosomes due to change in concentration of choletserol.
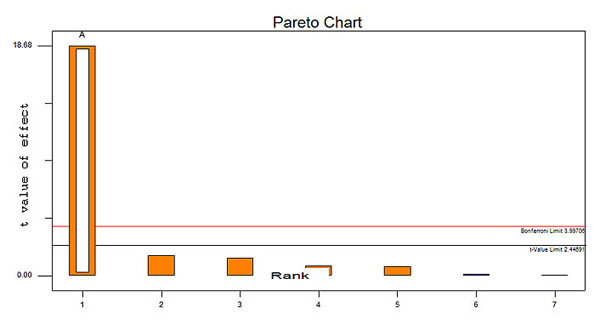 |
Fig. (7). Pareto diagram showing effects of individual factors on in vitro drug release study. |
5.5.4. Effect of Surfactant
The rate of release was the lowest for Span 40 and Span 60 and the highest for other types of Spans. This was attributed to higher phase transition temperature (Tc) for Span 40 and Span 60 than that of other Spans. So, Span 40 and Span 60 form vesicles with less permeable and less leaky rigid bilayers than other Spans which form more permeable fluid bilayers. Moreover, Span 80 possesses an unsaturated alkyl chain, which makes the membrane more permeable [26].
In the present study as millimole of span 60 increases the permeability of drug increases.
From 23 factorial design batch P8 was considered as optimized formulation. In vitro drug release of batch P8 was significantly more as compared to that marketed formulation in vitro drug release. This indicated that bifonazole from optimized niosomal gel formulation was more permeable than from marketed formulation.
5.6. Characterization of Bifonazole Niosomes and Niosomal Gel
5.6.1. Entrapment Efficiency Determination
After the removal of unentrapped drug by centrifugation, the entrapment efficiency of all the formulations was studied. No significant effect of different process variables was found on the entrapment of drug in niosomes. The entrapment efficiency of all eight formulation (P1-P8) was found in the range of 98.32 ± 0.04% to 99.85 ± 0.02% .
5.6.2. Microscopic Examination
Niosomes were observed under microscope as seen in photomicrograph having round shape, unilamellar and also multilamellar. No crystals were found. Photomicrographs of vesicles are shown in Fig. (8).
 |
Fig. (8). Photomicrographs of vesicles. |
5.6.3. Size Distribution Study and Zeta Potential Measurement
The z-average of bifonazole niosome was 570.6 nm according to size distribution study. The zeta potential for bifonazole niosome was found to be -22.6. Negative surface charge was due to ionization of free groups present on the surface of various niosomes [27].
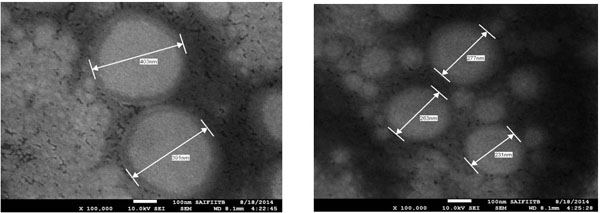 |
Fig. (9). Vesicular Size of optimized formulation obtained by SEM. |
5.6.4. Scanning Electron Microscopy (SEM)
SEM photographs (Fig. 9) showed that the prepared niosome exhibited smooth surface with nano size dimension and were homogenously distributed. The diameter of the prepared niosome was in range of 231- 403 nm when seen through electron microscope.
5.6.5. PH of Niosomal Gel
Skin compatibility is the primary requirement for a good topical formulation. The pH of all the formulations was in the range of 5.9 to 6.7 which suits the skin pH, indicating skin compatibility. The results of pH determination are reported in Table 8.
5.6.6. Viscosity of Gel
The viscosity of the gel formulations generally reflects its consistency. Viscosity of all the formulations were performed and results are summarised in Table 8. The viscosity of optimized batch was found to be 8700 centipoise.
5.6.7. Spreadability of Niosomal Gel
The values of spreadability indicated that the gels were easily spreadable by small amount of shear. Spreading diameter after 2 min of prepared gel was between 4.7-6.8 cm which indicates good spreadability of niosomal gel. All the developed formulations showed good homogeneity with absence of lumps. The results of speadability of all formulation are summarized in Table 8.
Evaluation parameters of the prepared niosomal gel.
| Formulation | Entrapment efficiency* (%) | Viscosity (centipoise) |
pH of gel | Spreadability (g.cm/sec) | Drug content * (%) |
|---|---|---|---|---|---|
| P1 | 98.32±0.04 | 11400 | 6.1 | 15 | 100.36±0.47 |
| P2 | 99.79±0.03 | 8400 | 6.4 | 20.27 | 99.31±0.55 |
| P3 | 99.65±0.05 | 9500 | 5.9 | 13.39 | 98.56±0.37 |
| P4 | 99.16±0.04 | 9800 | 6.2 | 14.85 | 98.37±0.49 |
| P5 | 99.67±0.03 | 11500 | 6.5 | 15.46 | 98.04±0.81 |
| P6 | 98.88±0.04 | 8800 | 6.12 | 18.75 | 100.56±0.51 |
| P7 | 99.84±0.01 | 10700 | 6.48 | 14.42 | 100.32±0.41 |
| P8 | 99.85±0.02 | 8700 | 6.7 | 14.15 | 99.30±0.60 |
5.6.8. Comparative Study of Optimized Niosomal Gel with Marketed Formulation
5.6.8.1. In vitro Drug Release Study Through Dialysis Cellophane Membrane
The comparative in vitro drug release data is represented graphically in Fig. (10). The cumulative percentage amount of drug release was found to be 39.83 ± 0.30 and 49.56 ± 0.11 respectively, for marketed cream and optimized niosomal gel at the end of 7 hr. Cumulative percentage release of optimized niosomal gel was quite high as compared to marketed formulation.
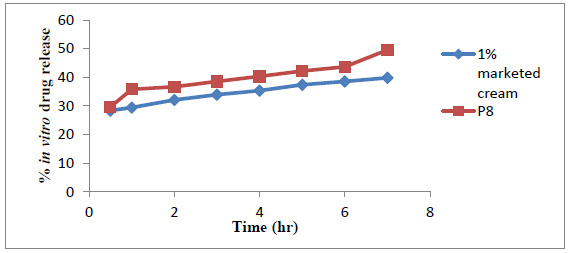 |
Fig. (10). Comparative study of in vitro drug release study. |
5.6.8.2. Interpretation of Permeation Mechanism
In vitro drug release of each formulation (P1-P8) was fitted to different equations and kinetic models to explain the kinetics of bifonazole from niosomal gel (Table 9). The best fit with the highest coefficient of determination R2 was shown by zero order permeation for formulations (P2, P4, P5, P7, P8). The formulation P3 and P6 were best fitted for Higuchi kinetic equation as the formulation coefficient of correlation values predominates over zero-order and first-order kinetics. This indicated drug permeation mechanism by diffusion, i.e. a slow and sustained permeation of drug from membrane, as proposed by Higuchi. The diffusion mechanism of drug release was further confirmed by Korsmeyer-Peppas plots that showed fair linearity (R2 values between 0.84 and 0.979), with slope values less than 0.5 indicated that the mechanism of drug release from all the formulations could be described as a quasi-Fickian diffusion mechanism.
5.6.8.3. Ex-vivo Permeation Study
The increased drug release in case of niosomal gel is due to the non-ionic surfactant present in it, which will modify the structural composition of stratum corneum and increase the thermodynamic activity of the drug as well as skin vesicular partitioning. The % cumulative drug release of ex-vivo permeation study of optimized niosomal gel P8 (49.26%) and Marketed formulation (40.56 %) is shown in Fig. (11).
Release kinetics data.
| Formulation code | Zero order | First order | Higuchi release model | Korsemeyar’s Peppa | |
|---|---|---|---|---|---|
| R2 value | ‘n' value | ||||
| P1 | 0.867 | 0.880 | 0.932 | 0.953 | 0.113 |
| P2 | 0.990 | 0.991 | 0.98 | 0.944 | 0.140 |
| P3 | 0.945 | 0.949 | 0.980 | 0.979 | 0.092 |
| P4 | 0.982 | 0.976 | 0.933 | 0.854 | 0.111 |
| P5 | 0.982 | 0.982 | 0.971 | 0.928 | 0.098 |
| P6 | 0.964 | 0.972 | 0.990 | 0.967 | 0.143 |
| P7 | 0.981 | 0.978 | 0.923 | 0.84 | 0.119 |
| P8 | 0.918 | 0.918 | 0.914 | 0.907 | 0.146 |
 |
Fig. (11). Comparative study of ex-vivo permeation study. |
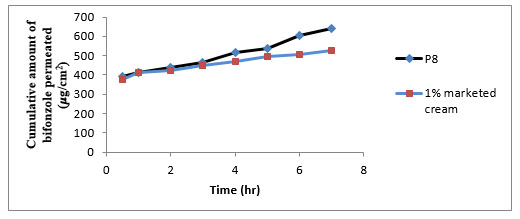 |
Fig. (12). Cumulative amount of bifonazole permeated through rat skin. |
In this study the permeation data obtained from bifonazole niosomal gel (P8) was compared with 1 % marketed cream. Table 10 and Fig. (12) show skin permeation of bifonazole niosomal gel. The cumulative amount of bifonazole permeated from 1% marketed cream was low as compared to formulation P8. The flux of bifonazole from formulation P8 was high (38.12 μg/cm2/ hr) with high permeability coefficient (0.01906). The high flux (38.12 μg/cm2/ hr) in formulation P8 could be due to penetration enhancement effect of nonionic surfactants in vesicles. The enhancement ratio of formulation P8 was increased 1.8 folds.
Cumulative amount permeated, flux, and permeability coefficient of ex vivo permeation study.
| Formulation | Cumulative amount permeated (μg/cm2) |
Flux (μg/cm2/hr) | Permeability coefficient(cm2/hr) | Enhancement ratio |
|---|---|---|---|---|
| P8 | 640.36 | 38.12 | 0.01906 | 1.8 |
| 1% Marketed cream | 527.25 | 21.14 | 0.01057 | 1 |
5.6.8.4. Deposition Study
Skin deposition studies performed by using rat abdominal skin. Results of % drug retained in skin are shown in Table 11. Results indicated that drug was retained in the skin layers was more in case of niosomal gel formulation as compared to marketed formulation. Thus, niosomal gel formulations enhanced the permeation of the drug in epidermal layer. As indicated in Table 10, the in vitro drug release (%) and drug retained in skin (%) of optimized batch (P8) was more as compared to 1% marketed cream and hence no or much less waste of drug remained on skin after 7 hr. But in case of 1% marketed cream the drug remained on skin after 7 hr was more. Hence, this may be advantage of optimized batch (P8) that applied amount of drug was permeated skin completely.
Release kinetics data.
| Formulation | In vitro drug release (%) | Drug retained in skin (%) |
|---|---|---|
| Optimized batch (P8) | 49.26 | 49.5 |
| 1% marketed cream | 40.56 | 37.23 |
6. STABILITY STUDY
Stability studies of all prepared niosomes were performed by storing at 5° ± 3°C, 25°C ± 2°C for a period of three months. The appearance, spreadability, pH of gel, drug content and cumulative percentage drug release was determined at the end of three months (Table 12). It was observed that there was no change in appearance, spradability, pH of all formulations. In vitro drug release at room temperature (25°C ± 2°C) was less as compared to refrigerator (5° ± 3°C). Hence, it is concluded from the obtained data that the optimum storage condition for niosomal gel is 5° ± 3°C.
Results of stabiliy study of optimized batch (P8).
| Parameters evaluated | Period | Room Temperature (25°C ± 2°C) | Refrigerator (5°± 3°C) |
|
|---|---|---|---|---|
| Appearance of gel | At the end of 3 months | No change | No change | |
| pH of gel | At the end of 3 months | 6.65 | 6.68 | |
| Spreadability | At the end of 3 months | 14.13 | 14.11 | |
| Drug content | 1st month | 98.88 ± 0.08 | 99.21 ± 0.18 | |
| 2nd month | 97.76 ± 0.22 | 98.63 ± 0.05 | ||
| 3rd month | 96.28 ± 0.08 | 98.31 ± 0.07 | ||
| In vitro drug release study (%) at the end of 7th hr | 1st month | 48.63 ± 0.12 | 49.15 ± 0.12 | |
| 2nd month | 46.40 ± 0.007 | 48.00 ± 0.007 | ||
| 3rd month | 45.19 ± 0.02 | 47.00 ± 0.044 | ||
CONCLUSION
Niosomal dispersion was successfully prepared by thin film hydration method. The concentrations of Span 60, cholesterol were optimized by factorial design to obtain stable niosomal dispersion devoid of aggregation, fusion and sedimentation (visual observation). In conclusion, vesicular formulation may include more factor during preparation making the interpretation of the system more complicated. In order to select the significant factors, it is suggested that processing factors are set at high and low levels, i.e. maximum and minimum settings of their operational ranges. Plackett-Burman design can be used for screening-out numerous factors. The use of screening design, as described in the present study, diminished considerably the number of experiments and gave as much as possible information and useful conclusions for the main effects of the examined factors. Process parameter that impacts the in vitro drug release study significantly are Millimole (mM) of surfactant and cholesterol, time of hydration, hydration temperature. Operational ranges of these parameters should be optimized in order to produce quality product in a repeatable manner. In order to examine further the isolated significant factors for their main effects and their interactions 23 factorial design was used and optimized batch was selected and evaluated. It was found that drug was not stable in buffer media, but drug was stabilized by using surfactant tween 80 (1%) and niosomal gel was able to permeate more than marketed formulation. The study showed that the niosomal formulation enhances the penetration of drug through the skin, and the optimized formulation did not show any formulation problems associated with it. The gel also passes the short term stability studies, indicating stability of formulation at 5°±2°C.
ABBREVIATIONS
CONFLICT OF INTEREST
The authors confirm that this article content has no conflict of interest.
ACKNOWLEDGEMENTS
The authors are thankful to Hyderabad (Sindh) National Collegiate Board’s Dr. L.H.Hiranandani College of Pharmacy, Ulhasnagar, for providing the laboratory facilities to carry out the present investigation.