RESEARCH ARTICLE
Computational Studies on Imidazo[1,2-a] Pyridine-3-Carboxamide Analogues as Antimycobacterial Agents: Common Pharmacophore Generation, Atom-based 3D-QSAR, Molecular dynamics Simulation, QikProp, Molecular Docking and Prime MMGBSA Approaches
Suraj N. Mali, Hemchandra K. Chaudhari*
Article Information

Identifiers and Pagination:
Year: 2018Volume: 5
First Page: 12
Last Page: 23
Publisher Id: PHARMSCI-5-12
DOI: 10.2174/1874844901805010012
Article History:
Received Date: 28/06/2018Revision Received Date: 29/8/2018
Acceptance Date: 10/9/2018
Electronic publication date: 28/09/2018
Collection year: 2018
open-access license: This is an open access article distributed under the terms of the Creative Commons Attribution 4.0 International Public License (CC-BY 4.0), a copy of which is available at: https://creativecommons.org/licenses/by/4.0/legalcode. This license permits unrestricted use, distribution, and reproduction in any medium, provided the original author and source are credited.
Abstract
Background:
IMB-1402, Q203 and ND09759 analogs were found to have strong efficiency against Multi-drug-resistant tuberculosis (MDR-TB)/Extensively drug-resistant tuberculosis (XDR-TB) strains.
Objectives:
To know the structural necessities for imidazo[1,2-a]pyridine-3-carboxamide analogues, we intended to develop the ligand-based pharmacophore, Quantitative structure–activity relationship models(3D-QSAR model). We also performed Molecular docking, molecular simulation and Prime/Molecular Mechanics Generalized Born Surface Area (Prime/MM-GBSA) studies.
Methods:
All the studies like Common pharmacophore hypothesis generation, Atom based 3D-QSAR study, Prime MMGBSA, Docking, Qikprop, and Molecular dynamics simulation were processed using various modules incorporated within the maestro software interface from Schrodinger, LLC, New York USA (release 2017).
Results:
The common pharmacophore hypothesis(CPH) generation resulted in a five-featured hypothesis HHPRR, containing 1 positive, 2 hydrophobic and 2 aromatic rings. An Atom-based 3D-QSAR model was predicted for twenty seven training sets (a correlation coefficient i.e.R2= 0.9181,Standard deviation i.e.SD =0.3305, variance ratio i.e. F = 85.9) and eleven test sets (cross-validation correlation coefficient i.e.Q2 =0.6745, Root Mean Square Error i.e. RMSE = 0.65, Pearson R = 0.8427, P=1.21E-12) compounds employing alignment based on CPH. The dataset of thirty-eight molecules was allowed for docking into the active site of pantothenate synthetase (PDBID-3IVX) that shows H-bonding (Hydrogen bonding) interactions with residues Gly158, Met195, Pro38 and additionally shows further Pi-cation interactions with a residue like Hie47. We also obtained good simulation results for1.2ns study.
Conclusion:
From the results, the generated 3D-QSAR model may be applicable for additional designing of various novel potent derivatives in the future.
1. INTRODUCTION
Tuberculosis (TB) is a global health concern that is caused primarily by Mycobacterium (MTB). In recent years, the emergence of MDR and XDR TB strains has amplified the incidences of TB. Additionally, TB could be a co-infection of HIV-AIDS and accounts for the twenty-sixth percent of AIDS connected deaths worldwide [1]. In 2012, an estimated 8.6 million individuals suffering from M. tuberculosis and 1.3 million died from the disease, together with 320,000 deaths among HIV-positive individuals [2, 3]. So as to deal with these problems we have to design, synthesize and develop potent anti-mycobacterial agents. Recently, it had been found that imidazo[1,2-a]pyridine-3-carboxamide (IPC) derivatives prevent Mycobacterial activity. Two candidates Q203 and ND09759 were reported to possess inhibitory potency against each MDR and XDR strains Fig. (1). The IMB-1402 candidate Fig. (1) displayed acceptable safety and pharmacokinetic properties. The current study was meted out with the aim to get a Phase generatedCPH, 3D-QSAR and molecular docking studies of familiar antimycobacterial inhibitors [1]. We intended to develop the pharmacophore model that primarily signifies the importance of specific structural features. The important features include hydrophobicity, nature of atoms, the functional groups and aromatic features of molecules required for targeting a selected protein. A 3D-QSAR model (Atom-based) was conjointly developed for relating the SAR between a dataset of molecules using PHASE (Schrödinger, 2017) with their activities [4]. The intermolecular interactions including the mode of binding between ligands and the pantothenate synthetase protein (PDB ID-3IVX) were examined by the usage of Glide module of Schrödinger, 2017 software system package [5, 6].
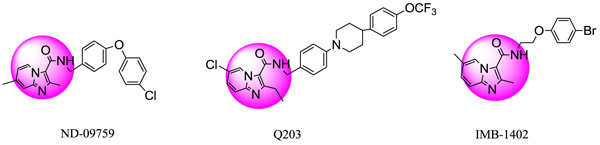 |
Fig. (1). Structures of ND-09759, Q203 and IMB-1402. |
2. MATERIALS AND METHODS
2.1. Software and Hardware
The CPH generation and Atom-based 3D-QSAR studies were processed using a phase module incorporated within the maestro software interface from Schrodinger, LLC, New York USA (release 2017) [6]. The studies related to docking were also additionally performed using Glide module (release 2017, Schrödinger, LLC, NY) installed on Linux based Computer. The molecular dynamic simulation study and Absorption, Distribution, Metabolism, Excretion and Toxicity (ADMET) properties predictions were done using DESMOND and QikProp modules respectively [7, 8].
2.2. Dataset
A set of thirty-eight IPC derivatives having mycobacterium inhibitory activity was used for 3D-QSAR study as shown in Table 1. The compounds within the set were divided randomly into 70% of the training set and 30% of test set molecules. Twenty-seven molecules in the training test and eleven molecules in the test set were used for developing the Phase CPH.
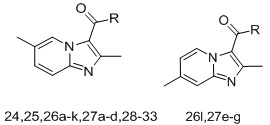
| Compd.ID | R | MIC(µM) | Compd. ID |
R | MIC (µM) |
|---|---|---|---|---|---|
| 24 | 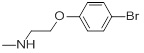 |
0.038 | 27f | 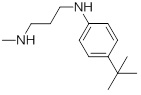 |
10.58 |
| 25 | 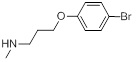 |
0.62 | 27g | 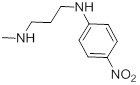 |
87 |
| 26a | 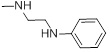 |
0.81 | 28a | 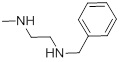 |
49.61 |
| 26b | 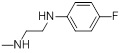 |
1.53 | 28b |  |
9.97 |
| 26c |  |
0.76 | 29a |  |
1.93 |
| 26d |  |
0.64 | 29b | 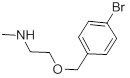 |
0.62 |
| 26e | 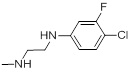 |
1.39 | 30a | 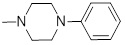 |
95.42 |
| 26f | 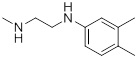 |
0.18 | 30b | 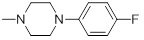 |
90.35 |
| 26g | 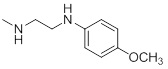 |
0.044 | 30c | 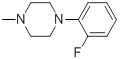 |
90 |
| 26h | 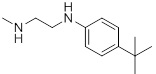 |
0.041 | 30d | 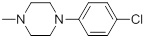 |
43.47 |
| 26i | 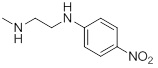 |
90 | 30e | 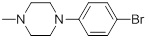 |
77 |
| 26j | 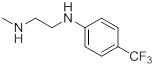 |
42.55 | 30f |  |
86 |
| 26k |  |
5.31 | 30g |  |
45.98 |
| 26l |  |
47.31 | 30h | 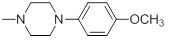 |
87 |
| 27a | 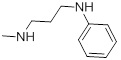 |
6.21 | 30i | 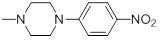 |
84.43 |
| 27b | 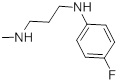 |
1.47 | 31 | 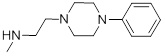 |
0.66 |
| 27c | 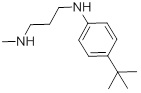 |
1.32 | 32a | 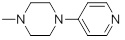 |
95.04 |
| 27d | 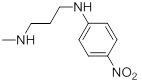 |
87 | 32b |  |
95 |
| 27e |  |
12.43 | 33 |  |
90.33 |
2.3. Molecular Docking studies and Prime MMGBSA:
Overall, molecular docking comprises 5 main steps-1] protein preparation, 2] ligand preparation, 3] receptor grid generation, 4] ligand docking procedure and then 5] viewing the docking results. Prime MMGBSA generated properties are helpful in determining energies for ligand-receptor complex [9-12].
2.4. ADMET Predictions by QikProp
For predicting the ADMET properties, we utilized the QikProp module (Schrödinger, LLC, NY). The various physically significant descriptors and pharmaceutically relevant properties of organic molecules are nowadays predicted by QikProp. In addition to predicting molecular properties, QikProp provides ranges for comparing a particular molecule’s properties with those of 95% of known drugs. QikProp also flags 30 types of reactive functional groups that may cause false positives in high-throughput screening (HTS) assays [8].
2.5. Molecular Dynamics
Molecular dynamics (MD) simulations study was performed with the docking complex of Pantothenate synthase with molecule 26k by using Desmond 3.8 as implemented in Schrödinger package with 1.2 ns (nanoseconds) simulation time. The OPLS-2005 molecular mechanic's force field was used for performing the initial steps. The full system of 39341 atoms was simulated through the multistep MD protocols of Maestro version 11.1.011; release 2017. The trajectory was kept at 4.8 ps time and number of frames at 250. Ensemble class was kept at NPT with temperature 300k and pressure at 1.01325 bar. We used the option for relaxing the model before simulation. Finally, the job was allowed to run [7].
2.6. Pharmacophore Studies (Generation of the Common Pharmacophore Hypothesis (CPH))
The actives and inactives are the two parts of our dataset molecules which were used for developing the CPH.
For CPH generation and Atom-based 3D-QSAR analysis, a dataset of 38 compounds was used. All these operations were carried out using PHASE drug design software (Schrodinger 2017 release, Inc.). The computations were performed on a Linux based computer having a processor of 2 GHz and memory 512 RAM. Macromodel with OPLS 2005 force field was used in minimizing the dataset structures. Previously minimized LigPrep structures were allowed to import in PHASE having protonation states at physiological pH 7.4 ± 0.0. Dataset was defined with criteria like - compounds with MIC (-log) >5.40 mol/l were considered as active, while those with MIC (-log) < 4.30 mol/l as inactive. Default pharmacophore features in PHASE are hydrogen bond acceptor (A), hydrogen bond donor (D), hydrophobic (H), negative (N), positive (P) and aromatic ring (R). Default definitions were used for generating the hypothesis. Finding common pharmacophore, the maximum number of sites was set to 5 and minimum to 3. Box size of pharmacophore was adjusted to 2 Å. Active and inactive molecules were scored for a given pharmacophore using default weights of scoring parameters. Top ranking hypotheses were subjected to 3D-QSAR analysis for which grid spacing was 1 Å and maximum PLS factors 3. 27 molecules to the training set and 11 molecules to the test set were assigned, based on the variation in structure and biological activity [13-18].
2.7. 3D-QSAR
The 3DQSAR models from PHASE are either based on pharmacophore or on atoms [15]. Since all the ligands used are in the congeneric series, that is why we used 3D-QSAR models based on atoms. These were generated using the best 5 point HHPRR hypothesis. The hypothesis was generated using 27 molecule training set and a grid spacing of 1.0 Q. 3D-QSAR model with three PLS factors was generated and further, validated with predicting activities of molecules in the test set [15].
3. RESULTS AND DISCUSSION
3.1. Docking Studies and Prime MMGBSA Study
The data set including the inbound (cocrystallized ligand) was docked into the binding pocket of pantothenate synthetase (PDBID: 3IVX) target enzyme. For the reliability of the docking protocol, we evaluated it through the RMSD value. The dataset 38 molecules were allowed for docking protocol to dock into the active site of pantothenate synthetase (PDBID-3IVX), which indicates hydrogen bond interactions with residues Gly158, Met195, Pro38 and also shows further Pi-cation interactions with a residue like Hie47. The average RMSD value was found to be 0.083 Ǻ. The result of docking studies in form of docking score is shown in Table 2. From the results obtained, we found that molecule 26k Fig. (2) has the highest binding affinity towards Ps (Pantothenate synthetase) with XP Gscore of -7.370 kcal/mol while natural ligand has binding affinity compared to molecule 26k with XP Gscore of -9.746 kcal/mol. We also, observed that molecule 27g from the dataset has the lowest binding affinity towards Ps with XP Gscore of –0. 972 kcal/mol Fig. (3). From Prime MMGBSA, we found that the DG binding energy for most docked molecule 26k (-63.425749 Kcal/mol) is more negative than least dock, 27g (-62.070189 Kcal/mol).
| Compound ID | QSAR set | Actual pIC50 | Predicted pIC50 | Docking score (XP) |
|---|---|---|---|---|
| 24 | Training | 7.42 | 6.555 | -4.084 |
| 25 | Training | 6.208 | 6.046 | -5.846 |
| 26a | Test | 6.092 | 5.615 | -5.933 |
| 26b | Training | 5.815 | 5.675 | -4.615 |
| 26c | Training | 6.119 | 6.357 | -4.583 |
| 26d | Training | 6.194 | 6.264 | -6.316 |
| 26e | Training | 5.857 | 6.455 | -6.156 |
| 26f | Test | 6.745 | 6.631 | -4.68 |
| 26g | Training | 7.357 | 6.861 | -3.379 |
| 26h | Test | 7.387 | 5.598 | -7.318 |
| 26i | Training | 4.046 | 3.843 | -3.849 |
| 26j | Training | 4.371 | 5.021 | -4.546 |
| 26k | Training | 5.275 | 5.349 | -7.37 |
| 26l | Training | 4.325 | 4.294 | -4.305 |
| 27a | Test | 5.207 | 5.335 | -4.447 |
| 27b | Training | 5.833 | 5.844 | -6.702 |
| 27c | Test | 5.879 | 5.530 | -5.006 |
| 27d | Training | 4.06 | 3.802 | -5.937 |
| 27e | Training | 4.906 | 4.759 | -4.926 |
| 27f | Training | 4.976 | 5.088 | -4.768 |
| 27g | Training | 4.06 | 3.705 | -0.972 |
| 28a | Training | 4.304 | 4.283 | -3.532 |
| 28b | Test | 5.001 | 5.768 | -5.16 |
| 29a | Training | 5.714 | 5.759 | -3.65 |
| 29b | Training | 6.208 | 6.576 | -5.123 |
| 30a | Training | 4.02 | 4.252 | -3.37 |
| 30b | Training | 4.044 | 4.298 | -6.801 |
| 30c | Training | 4.046 | 4.232 | -2.824 |
| 30d | Training | 4.362 | 4.254 | -5.465 |
| 30e | Test | 4.114 | 4.264 | -6.229 |
| 30f | Training | 4.066 | 4.212 | -3.652 |
| 30g | Test | 4.337 | 4.607 | -3.741 |
| 30h | Test | 4.06 | 4.232 | -4.218 |
| 30i | Training | 4.074 | 4.100 | -3.704 |
| 31 | Training | 6.18 | 6.080 | -5.498 |
| 32a | Test | 4.022 | 4.212 | -3.193 |
| 32b | Training | 4.022 | 3.880 | -5.446 |
| 33 | Test | 4.044 | 4.643 | -3.37 |
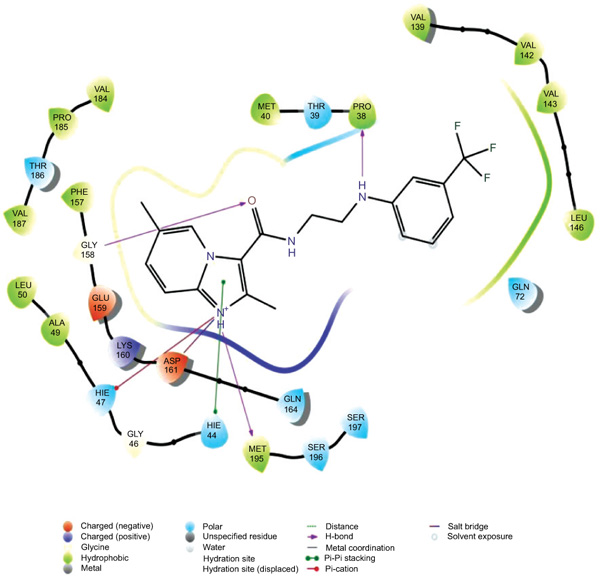 |
Fig. (2). Ligand interaction diagram with the most docked molecule 26k . |
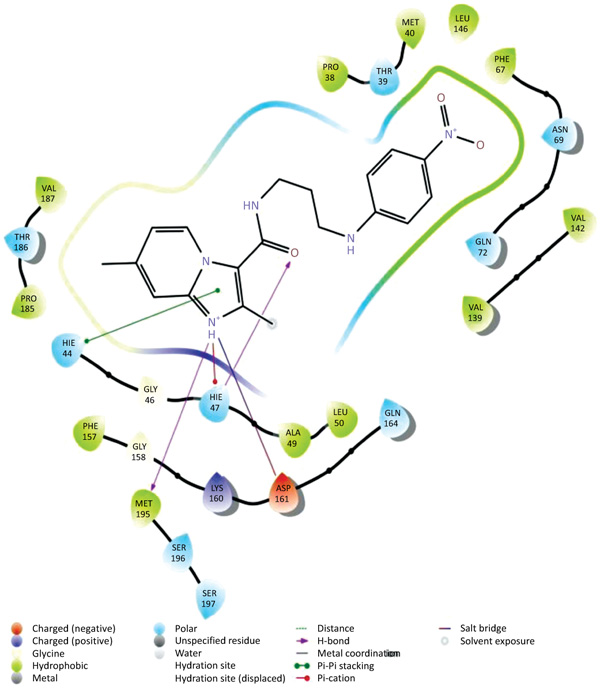 |
Fig. (3). Ligand interaction diagram with least docked 27g with Ps. |
3.2. QikProp pharmacokinetic Predictions
QikProp predicted ADMET properties i.e parameters offered the information related with molecular weight, partition coefficient (QPlogPo/w), stars, % oral absorption values and Lipinski’s properties (Rule of Five) and apparent Caco-2 cell permeability (QPPCaco) in nm/sec. The partition coefficient (QPlogPo/w) was found within the range for all our dataset molecules. Overall, the percentage of human oral absorption for compounds was found to be very good. Table 3 indicates that all parameters obtained were found within the acceptable range for human use, thus indicating their potential as a drug-like molecule. The data obtained for most active and least active molecules are mentioned in Table 3.
| property | Most Docked molecule 26k | Least docked molecule 27g |
| #stars | 0 | 1 |
| QPlogPo/w | 4.596 | 3.271 |
| QPPCaco | 1927.634(great) | 275.563 |
| % Human oral absorption | 100 | 89.776 |
| Rule of five | 0 | 0 |
3.3. Molecular Dynamics Simulations (MD)
The docking studies do not involve the flexible nature of the protein. For confirming the exact binding mode and stability, we have to study MD simulations with the Desmond program. The stability of Pantothenate synthetase (Ps) with molecule 26k complex was evaluated through 1.2 ns molecular dynamics simulations. The simulations provided exact binding interaction of the docking complex with system embedded with water molecules, temperature and pressure. The complex was originated in all proper binding poses with an acceptable RMSD value (< 3 Å). The RMSD of backbone atoms of the 3IVX models relative to initial structures indicates that stable molecular systems were obtained during MD (Fig. 4). The RMSD plots indicated that 3IVX-molecule 26k complex was more stable in the simulations study of 1.2ns. We also obtained the protein RMSF plot which shows the local changes that are useful for characterizing local changes in the protein chain (Fig. 5). According to MD simulation study, solvating water molecules were taken for checking the stability of the ligand-protein complex. MD simulations were closer to the physiological environmental conditions. The simulation study can reveal better binding conformations for the docked complex.
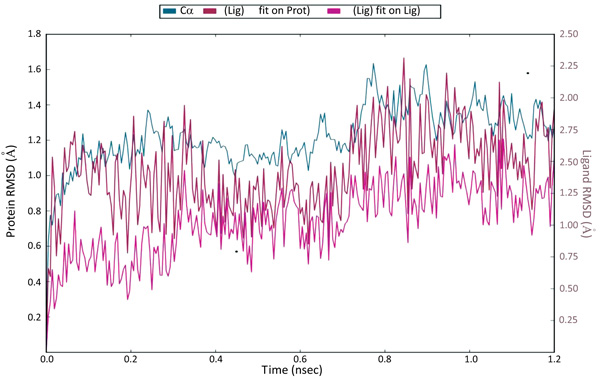 |
Fig. (4). The Root Mean Square Deviations (RMSD) of backbone atoms relative to the starting complexes during 1.2 ns MD. |
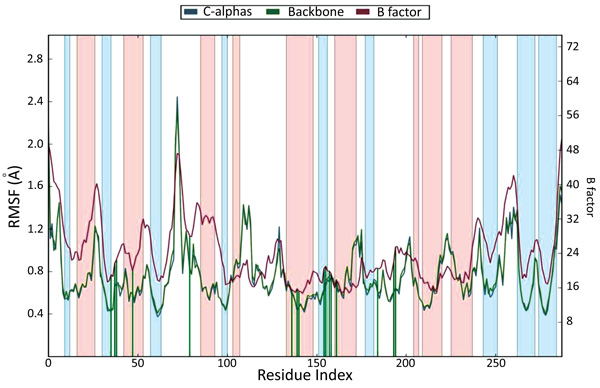 |
Fig. (5). Protein RMSF plot (On this plot, peaks indicate areas of the protein that fluctuate the most during the simulation and Protein residues that interact with the ligand are marked with green-colored vertical bars.) |
3.4. Common Pharmacophore Hypothesis Generation and Atom-Based QSAR Studies
3.4.1. Common Pharmacophore Hypothesis Generation
Ligand-based drug design is based on the understanding of known molecules which bind to the target of concern having some biological values. The minimum structural characteristics are necessary in order to bind to the target molecule. For developing CPH, these molecules can be helpful for that. The two parts of our experimental dataset were actives and inactives.The CPH which contains three to six features was generated. Finally, the common pharmacophore hypothesis HHPRR was generated Fig. (6). All the actives and inactives were aligned to HHPRR (5 points) hypothesis with the excluded volumes. The excluded volumes are the part of hypothesis where any feature of molecules should not clash in that region. The common pharmacophore hypothesis displays the 2 hydrophobic (green), 1 positive (blue) and 2 aromatic (orange circles) features Fig. (6). Further, the HHPRR hypothesis correlated with all the molecules in the active set.
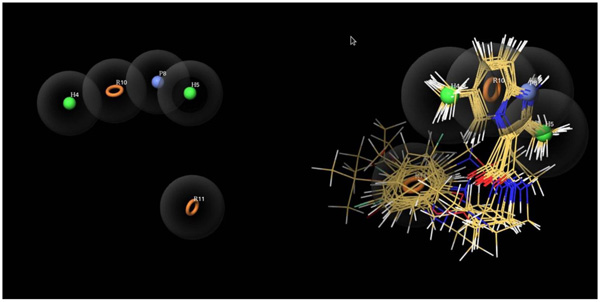 |
Fig. (6). Pharmacophore model (HHPRR) generated by PHASE. The HHPRR model illustrates hydrophobic feature (H4H5; Green colour), positive feature (P8; Blue) and aromatic rings (R10R11, Brown color) features. All active ligands overlapped on the generated model HHPRR. |
3.4.2. 3D-QSAR studies
3D-QSAR predicted biological activity related to the current experimental dataset is reported in Table 2. Visual inspection of the common pharmacophore which was subjected to QSAR analysis revealed hydrophobic, positive, ring features as the structural requirements playing a role critical for the activity. The Atom-based 3D-QSAR generated plots for training set and test set molecules indicate the satisfactory 3D-QSAR equation Fig. (7). A 3D-QSAR model was predicted for 27 training set (a correlation coefficient: R2= 0.9181, SD =0.3305, F = 85.9) and 11 test set (cross-validation correlation coefficient: Q2 =0.6745, RMSE = 0.65, Pearson R = 0.8427, P=1.21E-12) compounds using a pharmacophore-based alignment. The 3D QSAR statistics indicate the reliability of model Table 4.
| # Factors | R2 | Q2 | F | Stability | Pearson-r | SD | RMSE | P |
|---|---|---|---|---|---|---|---|---|
| 1 | 0.5813 | 0.5976 | 34.7 | 0.837 | 0.7828 | 0.7167 | 0.73 | 3.79E-06 |
| 2 | 0.8327 | 0.752 | 59.7 | 0.425 | 0.8895 | 0.4624 | 0.57 | 4.79E-10 |
| 3 | 0.9181 | 0.6745 | 85.9 | 0.318 | 0.8427 | 0.3305 | 0.65 | 1.21E-12 |
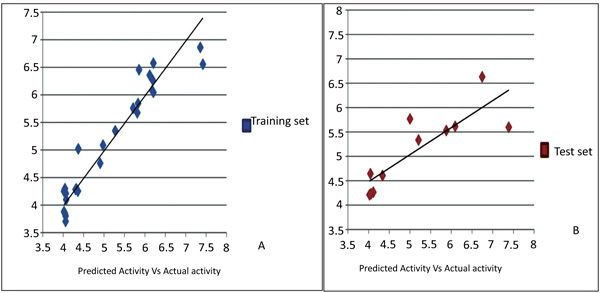 |
Fig.(7). Graphical presentation of actual versus predicted pIC50of training and test set molecules for obtained model. |
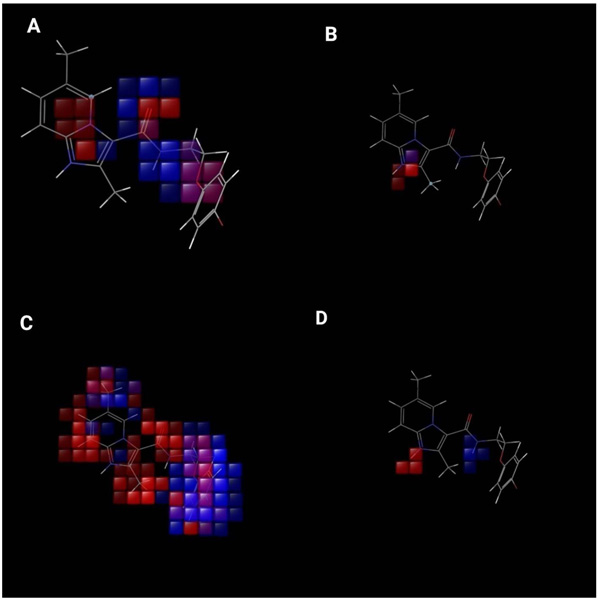 |
Fig. (8). (A--D) Visual representation of atom-based PHASE 3D-QSAR model.(A) Electron withdrawing, (B) positive ionic, (C) hydrophobic, and (D) hydrogen bond donor. Blue color cubes indicate positive coefficient or increase in activity and red colour cubes indicate negative coefficient or decrease in activity. |
3.4.3. Analysis of Atom-based PHASE 3D-QSAR models (QSAR visualization)
The contribution of substituents to biological activity can be effectively predicted by the QSAR visualization. Fig. (8) gives information related to 3D characteristics of the PHASE generated 3D- QSAR models. The cubes represent the model and the color codes assigned indicate their coefficient values according to the sign. The color for positive coefficients is blue while it is red for negative coefficients. Positive coefficients indicate increment in the biological activity while decrement in biological activity is well correlated with negative coefficients. These coefficients along with ligands are definitely helpful for ligands whether they tend to increase or to decrease the activity. This will help to determine the advantage or disadvantage for the particular functional group at particular positions in a compound.
CONCLUSION
We carried out our research for generating a common pharmacophore model, molecular docking, 3D-QSAR and simulation studies of imidazo[1,2-a]pyridine-3-carboxamide analogs as Antimycobacterial agents. The developed pharmacophore model HHPRR suggests roles of hydrophobic and ring features. The 3D-QSAR model was obtained for 27 training set (R2= 0.9181, SD =0.3305, F = 85.9) and 11 test set (Q2 =0.6745, RMSE = 0.65, Pearson R = 0.8427, P=1.21E-12) compounds. By utilizing the 3D-QSAR visualization, which showed herein this paper; favorable or unfavorable regions and substitutions required at respective places for potent biological activity which will help in designing more potent antimycobacterial agents in future. Thus, Docking, MD simulation, pharmacophore model and 3D-QSAR studies, QikProp ADMET predictions presented in the current study may be useful for the development of various novel IMB-1402 analogues. We hope that our study will help to invent novel, potent, selective and safe analogues for treating MDR/XDR tuberculosis.
LIST OF ABBREVIATIONS
| MDR-TB | = Multi-Drug-Resistant Tuberculosis |
| XDR-TB | = Extensively Drug-Resistant Tuberculosis |
| 3D-QSAR model | = 3D-Quantitative Structure–activity Relationship Models |
| Prime/MM-GBSA | = Prime/Molecular Mechanics Generalized Born Surface Area |
| CPH | = Common Pharmacophore Hypothesis |
| R2 | = correlation coefficient |
| Q2 | = cross-validation correlation coefficient |
| RMSE | = Root mean square error |
| PDB | = Protein Databank |
| ADMET | = Absorption, Distribution, Metabolism, Excretion and Toxicity properties |
| MD | = Molecular Dynamics simulation |
| MIC | = Minimum Inhibitory Concentration |
| IC50 | = Inhibitory Concentration |
| PLS | = Partial Least Squares |
| XP | = Extra Precision |
| #stars | = Number of property or descriptor values that fall outside the 95% range of similar values for known drugs. |
| QPlogPo/w | = Predicted octanol/water partition coefficient. |
| QPPCaco | = Predicted apparent Caco-2 cell permeability in nm/sec. |
| Percent Human Oral Absorption | = Predicted Human Oral Absorption on a 0 to 100% scale. |
| Rule of Five | = Number of violations of Lipinski’s rule of five. |
ETHICS APPROVAL AND CONSENT TO PARTICIPATE
Not applicable.
HUMAN AND ANIMAL RIGHTS
No Animals/Humans were used for studies that are base of this research.
CONSENT FOR PUBLICATION
Not applicable.
CONFLICT OF INTEREST
The authors declare no conflict of interest, financial or otherwise.
ACKNOWLEDGEMENTS
Authors thanks to AICTE-India and UGC startup grant-India for providing financial facility
REFERENCES
| [1] | Pulipati L, Sridevi JP, Yogeeswari P, Sriram D, Kantevari S. Synthesis and antitubercular evaluation of novel dibenzo[b,d]thiophene tethered imidazo[1,2-a]pyridine-3-carboxamides. Bioorg Med Chem Lett 2016; 26(13): 3135-40. |
| [2] | Lv K, Li L, Wang B, et al. Design, synthesis and antimycobacterial activity of novel imidazo[1,2-a]pyridine-3-carboxamide derivatives. Eur J Med Chem 2017; 137: 117-25. |
| [3] | Mali S. Extensively drug-resistant tuberculosis (XDR –TB): An overview. IJSRM. HUMAN 2016; 2(4): 47-56. [http://ijsrm.humanjournals.com/wp-content/uploads/2016/03/4.Mr_.-Suraj-Narayan-Mali.pdf]. |
| [4] | Phase 2017. |
| [5] | Glide 2017. |
| [6] | Schrödinger LL. Maestro, version 111 2017. |
| [7] | Desmond 2017. |
| [8] | Qikprop 2017. |
| [9] | Prime 2017. |
| [10] | Ligprep 2017. |
| [11] | Friesner RA, Banks JL, Murphy RB, et al. Glide: A new approach for rapid, accurate docking and scoring. 1. Method and assessment of docking accuracy. J Med Chem 2004; 47(7): 1739-49. [http://dx.doi.org/http://dx.doi.org/10.021/jm0306430]. |
| [12] | Halgren TA, Murphy RB, Friesner RA, et al. Glide: A new approach for rapid, accurate docking and scoring. 2. Enrichment factors in database screening. J Med Chem 2004; 47(7): 1750-9. |
| [13] | Velingkar V, Chindhe A, Gatane M, Sanaye M, Gadkari Y, et al. 3D-QSAR, synthesis and evaluation of novel piperidinylaminomethyl aryl sulfonamides with memory enhancing activity. JSM Chem 2016; 4(1): 1018. [http://www.jscimedcentral.com/Chemistry/chemistry -4-1018.pdf]. |
| [14] | Polanski J. Self-organizing neural networks for pharmacophore mapping. Adv Drug Deliv Rev 2003; 55(9): 1149-62. [http://dx.doi.org/10.1016/S0169-409X(03)00116-9]. [PMID: 12954196]. |
| [15] | Rathee D. Pharmacophore modeling and 3D QSAR studies for prediction of matrix metalloproteinases inhibitory activity of hydroxamate derivatives. Biot Res and Inno 2017; 1(1): 112-22. |
| [16] | Todeschini R, Consonni V. Handbook of molecular descriptors: Methods and principles in medicinal chemistry 2000. |
| [17] | Yang SY. Pharmacophore modeling and applications in drug discovery: Challenges and recent advances. Drug Discov Today 2010; 15(11-12): 444-50. |
| [18] | Salam NK, Nuti R, Sherman W. 2009; Novel method for generating structure-based pharmacophores using energetic analysis. J ChemInf Model 2009 ; 49(10): 2356-68.http://dx.doi.org/http://dx.doi.org/10.1021/ci900212v |