RESEARCH ARTICLE
The Effect of Adding Indirect Relationship to Turbo Similarity Searching
Nurul H. A. Hassain Malima, *, Yong Pei-Chiaa, Marwah H. Al-Lailaa, b, Shereena M. Arif c
Article Information

Identifiers and Pagination:
Year: 2016Volume: 3
First Page: 99
Last Page: 116
Publisher Id: PHARMSCI-3-99
DOI: 10.2174/1874844901603010099
Article History:
Received Date: 05/06/2015Revision Received Date: 09/05/2016
Acceptance Date: 11/05/2016
Electronic publication date: 15/06/2016
Collection year: 2016
open-access license: This is an open access article licensed under the terms of the Creative Commons Attribution-Non-Commercial 4.0 International Public License (CC BY-NC 4.0) (https://creativecommons.org/licenses/by-nc/4.0/legalcode), which permits unrestricted, non-commercial use, distribution and reproduction in any medium, provided the work is properly cited.
Abstract
Background:
Turbo Similarity Searching (TSS) has been proved as one of the effective and simple searching method in Cheminformatics. Emerging from the conventional similarity searching, TSS depended on the concept of fusion where relationship between the target being sought and the compound in the database are indirect. Previous works has looked at only one level of indirect relationship and indicates that there are further potential that more levels of such relationship be added to TSS to increase its ability to recover more actives. Hence, in this work, we aimed to investigate the impact of the indirect relationship on TSS.
Method:
This study has further investigated the enhancement of TSS using additional layers of indirect relationship and fusion process. We implemented TSS by adding another layer of fusion between the target and database compound.
Results:
The experiments with MDDR database showed that the proposed new strategy described in this paper provide a way of enhancing the effectiveness of the TSS process in chemical databases. The experiments also showed that the increases in performance are particularly better when the sought actives are structurally diverse.
Conclusion:
We may conclude that the additional layers do increase the recall of TSS. Hence, the new TSS strategy could be used as an alternative to the old TSS.
1. INTRODUCTION
Chemoinformatics is a field that combines chemistry and computer science, which mainly contributes to discover unmet drugs [1]. Virtual screening is an approach in Chemoinformatics, which is used to screen out structures that have high probability of failing in the drug discovery process. The simplest method that is applied in virtual screening is similarity searching [2]. Similarity searching is the process that involves the comparison of the entire target structure to the structures of the database structures, which is based on the degree of similarity between the structures. The principle embedded in the searching process is Similarity Property Principle.
Similar Property Principle is the very first idea enunciated explicitly by [3]. This principle is the general idea being applied in virtual screening, which states that chemical structures that are similar to a structure of interest will always possess some similar characteristics [3]. Therefore, according to the principle, a chemical molecule that resides in a database which has not been tested for biological activity, containing some levels of structural similarity to a molecule that is known to exhibit the activity of interest (i.e. target or reference structure), is considered as having a higher chance to be active. In a comparison among database-molecules, the molecule that has a higher degree of similarity to the target structure is more likely to be active than the others [4].
Another important concept related to the Similar Property Principle studied by Patterson et al. is the Neighborhood Behavior. This study stated that structures that reside in the same region are likely to have some similar properties [5]. The use of neighborhood behavior has been proven to efficiently increase the performance of the searching process [6, 7].
A chemical similarity searching (SS) strategy involves the calculation of the degree of resemblance between the target structure and every molecule in the database. Then, the database molecules are ranked in a decreasing order based on the similarity score. The vital idea in this strategy is to screen only the top-ranked database molecules.
SS is a single target search that had been enhanced into multi-target search systems that works based on Neighborhood Behavior. There are two interrelated methods that had been suggested by the Willett’s group in Sheffield i.e. Group Fusion (GF) and Turbo similarity searching (TSS). GF works by combining the searching results of SS with a number of different queries (often ten). Whereas TSS is an enhanced SS via incorporation of GF at the second stage of the algorithm.
In the first stage of TSS, an SS is conducted resulting in a list of nearly similar structures that are ranked in descending order using the similarity score. The top-ranked structures are known as the nearest neighbors (NN) which is assumed to own the same biological activity of the structure used as target in the SS. The second stage is proceeded by using a number of the NN as target in the SS and the results for each of them are combined to infer one final rank. This is the so-called GF that works on multi-structures emerging from one initial target. Willett’s group named this multi-target approach using the term turbo reflecting the ability of turbocharger to directly increase the power of an engine. Hence, TSS is analogous in this way, at which TSS uses the NN of target structure to increase the performance of a search engine [4].
 |
Fig. (1). Relationship residing in SS and TSS. |
Besides, the NN that appears in TSS is the contributor to the indirect relationship in the process. Based on (Fig. 1), direct relationship in SS exists between database structures and target structure, in order to ensure the retrieval process is solely based on structural similarities between them. However, in TSS, indirect relationship resides between database structures and target structure. Direct relationship only resides between target structure and NN, and between NN and database structures, which is clearly shown in Fig. (1). The work by Todeschini et al. [8] has reported an initial result of the newly implemented strategy of TSS that works by adding another layer of indirect relationship between the database and target structures based on one activity classes. This paper reports the full result that involved additional ten activity classes and further discusses the impact of the indirect relationship on the heterogeneity of activity classes.
2. BACKGROUND
2.1. Basic Components of SS and TSS
SS is applied in a fixed context to which target structures and database structures are represented by equivalent sets of molecular descriptors in which the similarity between these sets of descriptor is calculated using similarity coefficients. Molecular descriptors are usually vectors representing attributes of chemical structures. Whilst, similarity coefficients are numerical measures that are based on calculation of the degree of resemblance between structures.
The most widely used molecular descriptors are called fingerprints. Fingerprints are binary representation of a compound in a form of bitstrings or a Boolean array. Bitstrings are series of “0”s and “1”s in which each position corresponds to the presence (denoted by 1) or absence (denoted by 0) of a fragment in a chemical structure. They are calculated from 2D graph representation of chemical structrures. This descriptor exists in many variations based on how they are weighted. The above mentioned bitstrings are weighted by 1 for each fragment that is present. Another variant is weighted by the number of occurrence of those fragments that are present in the structure. These fingerprints can be generated using software such as Scitegic’s Pipeline Pilot to produce ECFP4 and ECFC4 fingerprints that correspond to each of the variant respectively [9]. The value 4 denotes the number of bonds taken into consideration by the software to generate the fingerprint by encoding the bond radius encircling an atom [9], where in this case there are four bonds. The third variant of the representation i.e SRECFC4 is weighted by the square root of the fragment occurrence fingerprint. Hence, the SRECFC4 is actually generated by applying a square root on ECFC4.
Similarity coefficients on the other hand enumerate the degree of resemblance between compounds in two forms i.e. dichotomous and continuous. There are a number of coefficients that are being used by researchers but the most popular and acknowledged as an industrial standard is the Tanimoto coefficient [10]. For ECFP4 representation, a dichotomous version of the coefficient is being used and the similarity is described based on four terms. Let A and B be the compound to be compared represented by the binary bits. The first term, a, is the count of bits “on” in A. The second is b, the count of bits “on” in B. The third term, c, is the count of bits “on” in both A and B. The final term is d which is the count of “off” bits in both A and B. Thus as shown in Equation 1.
 |
(1) |
where n is the total number of bits in the bitstring. The similarity of both compound is given by S(A,B). Hence, the Tanimoto formula would hold the following Equation 2.
 |
(2) |
Where similarity values calculated range from 0 – 1. Whereas the Tanimoto formula for the ECFC4 and SRECFC4 representation is in a continuous form as in Equation 3.
 |
(3) |
where xjA and xjB are the values of the jth attribute in objects A and B, respectively. The length of fingerprints is symbolized by n which is the total number of attributes of an object. Note that object in our case are structures under considerations and that all values xjA, xjB are non-negative fragments occurrence weights.
SS produces a result set of structures with similarity score ranked from the most similar to dissimilar. The top 200 structures from this result set are selected as the NN and used as query structures in a separate SS procedure before being fused into the second phase of TSS. Fusion involves a fusion rule that determines how the result set produced by the NN is being combined. There are a number of fusion rules, as described in [11], one of which is the MAX fusion rule. This rule combines the result sets produced by taking the maximum value of similarity score for a particular structure. Hence, when n sets of result sets are to be fused, MAX will allocate the maximum value for every compound c that can be found in the database as described in Equation 4 below:
 |
(4) |
2.2. TSS Performance in Various Conditions
According to the observations of [12] by implementing TSS using ECFP4 fingerprint on MDDR database with MAX fusion rule, TSS yielded a better performance than the conventional SS [12].
At a later time, [13] applied another alternative way of TSS, at which machine learning procedure was used to replace the group fusion process. The NN that was obtained from the initial SS search were then processed by using machine learning method, which included the training set and test set. The training set was referred to the NN of the known reference structure and inactives which have a high degree of similar characteristics from the database. Lastly, the final output of the searching process was generated in a ranking form based on the training set [13].
Another previous work by [14] was done to determine and test the effect of different sets of structural representations (fingerprints) and database on the final performance of the chemical similarity searching strategies. Three types of fingerprints were used in the study. In every search, all of the active structures were used as the reference structures. The results showed that ECFP4 consistently provided the best results in SS and TSS among the various types of fingerprint. TSS usually obtains the best result recall value with either 50NN or 100NN. NCI database did not perform well in both of the searching strategies; while MDDR and World of Molecular BioActivity (WOMBAT) provided a more higher and consistent recall [14].
In the recent work of [15], the use of the Bayesian Inference Network (BIN) in ligand-based virtual screening was an alternative to improve the effectiveness of the approach. Later on, in order to improve the retrieval effectiveness of BIN, fragment reweighting was applied in the set of active reference structure. In this strategy, every fragment of the multireference structure was computed based on the number of occurrence time in the input set, and then a new weight was assigned to the fragment, whereby the value was called the reweighting factor. This approach is referred to as a BIN based on reweighted fragments, BINRF model and it is carried out with the MDDR database. The study showed that BINRF model had improved in the retrieval effectiveness of the similarity-based screening method. Moreover, this method has a very significant advantage in boosting the performance when there is a high degree of structural heterogeneity among the active structures that is being searched [15].
3. MATERIAL AND METHODS
In order to implement a new strategy based on the previous TSS process (which contains only three layers/phases, as shown in Fig. (2), the new strategy as described earlier in [16] has added in another two layers making it five layers as shown in Fig. (3). The first layer carries out SS, the second and third layers execute TSS, and the fusion processes are conducted in both the fourth and fifth layers.
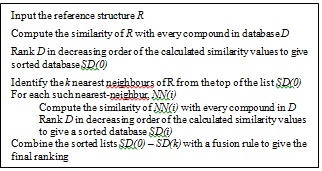 |
Fig. (2). TSS-GF Schematic Outline [9]. |
Table 1 shows the eleven activity classes being applied in the experiments. The table includes the number of active structures and the biological functions of the eleven activity classes. The database used was the MDL Drug Data Report (MDDR) database [17]. The version that was used in the experiments contains 102540 chemical molecules. The numbers of actives that were to be retrieved in this new strategy was based on the cut-offs at the top 1% of the database. Since there was a total of 102540 chemical molecules in the database, the cut-offs at the top 1% were the 1025 structures, which were assumed to be potential lead candidates in the experiment.
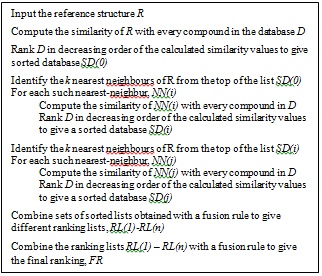 |
Fig. (3). Schematic outline of new strategy in turbo similarity searching. |
Activity classes used in MDDR database [15].
| Activity Class | Abbreviation | Biological Function | Number of Active Structures |
|---|---|---|---|
| 5HT1A agonists | 5HT1A | Treatment of anxiety and depression | 827 |
| 5HT3 antagonists | 5HT3 | Treatment for nausea and vomiting | 752 |
| 5HT reuptake inhibitors | 5HT Reuptake | 359 | |
| Angiotensin II AT1 antagonists | AT1 | Treatment for hypertension, diabetes nephropathy and cognitive heart failure | 943 |
| Cyclo-oxygenase inhibitors | COX | Relief inflammation and pain | 636 |
| D2 antagonists | D2 | Treatment for symptoms of schizophrenia | 395 |
| HIV protease inhibitors | HIVP | Prevent viral replication | 750 |
| Protein kinase C inhibitors | PKC | Regulate cell growth and transcription, mediate immune response and modulate membrane structure | 453 |
| Renin inhibitors | Renin | Reduce blood pressure and treatment for hypertension | 1130 |
| Substance P inhibitors | SubP | Associated with intense and chronic pain | 1246 |
| Thrombin inhibitors | Thrombin | Delay blood clotting | 803 |
The recall value for the similarity searching process retrieved at the top-1% database was calculated using Equation 5, whereby the top-1% database structures can be referred to as the possible lead candidates for the drug discovery process. The calculation returned the percentage of number of actives retrieved at the end of the process (NOAR) compared to the number active structures (NOC) available in the activity class.
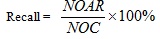 |
(5) |
Assume the activity class is 5HT1A, the number of active structures is 827, and the number of actives retrieved is 116, hence the percentage gained is 14%. This indicates that at least 14% of the structures from the top-1% MDDR database is showing positive to the target. The overall sets of combination that were used in the experiments are shown in Fig. (4). Whilst, the complete process of the work is presented in Fig. (5) which is extracted from [16].
The new strategy of TSS still maintained the four important elements, which include structural representation, similarity coefficient, fusion rule and nearest neighbors except that another layer of fusion was added. Previously TSS only included three layers. The first was the initial SS, second was the separate SS for the NN and the last was the fusion layer where all results of the second layer were combined to infer final ranking. This new strategy (Fig. 5) introduced two more layers where in the second layer, SS was only executed for 10NN whose output were then used for the consecutive SS in the third layer. At this layer only top 5NN from each result set were used as input to SS. These results were then fused in the fourth and fifth layer. The fusion in the fourth layer was corresponding to the action of combining result set from SS of the same NNth position in third layer that originates from different NN inputs. The similarity coefficient (i.e. Tanimoto coefficient), and fusion rule (i.e. MAX) were constant throughout the whole experiment. This paper focuses on the performance of the three different structural representations that are being used in the new strategy.
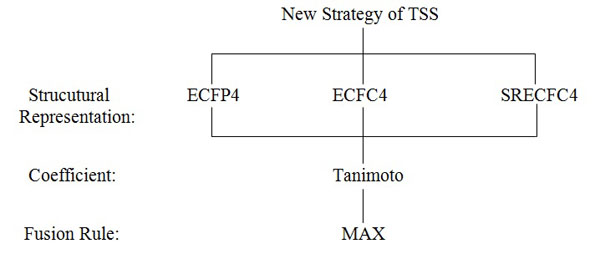 |
Fig. (4). TSS combinations used in the Experiments of the New Strategy. |
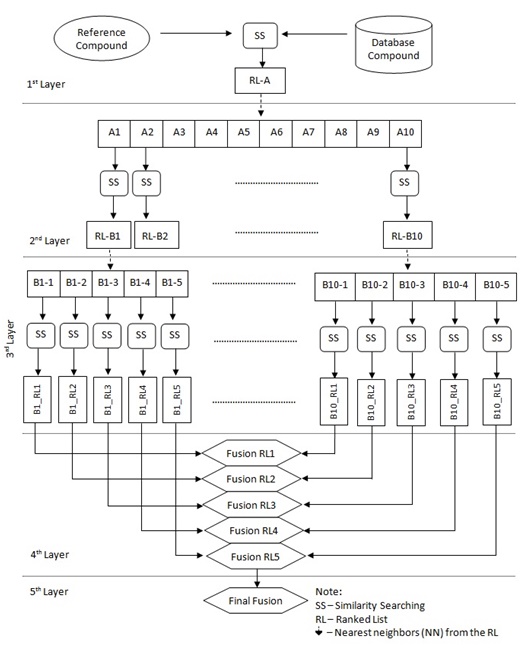 |
Fig. (5). The complete process of New TSS Strategy. |
4. RESULTS AND DISCUSSION
The work was carried out on the MDDR dataset where searches were focused on structures from the eleven activity classes listed in Table 1. A total of 330 searches were performed covering 10 queries from 11 activity classes with three distinct representations (i.e. ECFP4, ECFC4 and SRECFC). These searches were performed in accordance with the steps listed in Figs. (3 and 5). Note that, for each search, there were six different recall values gained corresponding to the six different fusion points encompassing Fusion RL1 to Fusion RL5 as well as Final Fusion. Thus, we shall discuss our findings based on recalls recorded in this new TSS as compared to the old ones with the addition of the effect of doing fusion at different layers and with different NN. The element that is to be taken into consideration is the number of occurrence of the highest recall (indicated by shaded cells) belonging to the particular groups (i.e. R1 to R5) in the fourth and fifth layers (i.e FR) of the new strategy.
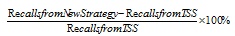
Apart from that, another evaluation that was used to analyze the results obtained is called the percentage of increase (POI). The calculation for the percentage of increase was done by dividing the difference between the recalls gained in new strategy and TSS from the recall value of existing TSS, as shown in Equation 6.
 |
(6) |
The subset dataset (i.e. the activity class) available for MDDR database is quite disparate in nature. For instance, some of the activity classes are structurally homogeneous (e.g. Renin and AT1), while some others are structurally diverse (e.g. COX and PKC). The diversity of each of the subset dataset has been estimated by [18, 19] using the mean pairwise Tanimoto similarity and is shown in Table 2. Hence the discussion will also revolve around the effect of structural diversities on the ability of the new strategy to retrieve more actives (recall); basing on previous works [12, 13, 20] that claimed the recall of existing TSS on homogenous classes are far better than those of the heterogeneous classes.
The diversity of MDDR Dataset activity class [19] sorted in descending where the homogeneity of classes decreases.
| Activity Class | Pairwise Similarity (Mean) | |
|---|---|---|
| Renin | 0.290 | Homogenous |
| AT1 | 0.229 |  |
| HIVP | 0.198 | |
| Thrombin | 0.180 | |
| SubP | 0.149 | |
| 5HT3 | 0.140 | |
| 5HT Reuptake | 0.122 | |
| D2 | 0.138 | |
| 5HT1A | 0.133 | |
| PKC | 0.120 | |
| COX | 0.108 | Heterogeneous |
4.1. Investigation on Highest Recall Values of the New Strategy and Existing TSS
The recall values obtained from the implementation of the new strategy are shown in three tables. Tables 3 to 5 are the recalls recorded based on ECFP4, ECFC4 and SRECFC4 fingerprints respectively. Note that, the numbers shown in brackets under the TSS column are referred to as the number of nearest neighbors used when the best recall value was attained in the existing TSS process [19]. Hence, they are used as a benchmark in this paper. The recall values of Fusion RL1(R1) to Fusion RL (R5) and Final Fusion (FR) are the mean recall obtained from the top-1% of the database. The mean recall value was obtained by averaging the recalls for each target structure in every particular activity class that was used in conducting the experiments. In this section the recall value gained at the final fusion layer (FR) and the recall value of the existing TSS is compared.
Overall, we observed that the new strategy has mostly been able to increase the recall values for all activity classes using all three types of fingerprints at all levels of fusion. However, we noticed that the fusion at the fifth layer has not been effective as those at the fourth layer. We also perceived that there were recalls for activity classes at certain fusion were below the benchmark.
The diversity of MDDR Dataset activity class [19] sorted in descending where the homogeneity of classes decreases.
| Activity Class | TSS | R1 | R2 | R3 | R4 | R5 | FR |
|---|---|---|---|---|---|---|---|
| 5HT1A | 13.22(20) | 13.74 | 14.58 | 14.80 | 14.84 | 14.06 | 14.68 |
| 5HT3 | 15.82(100) | 16.94 | 14.99 | 17.18 | 15.90 | 16.40 | 15.97 |
| 5HT Reuptake | 7.02(10) | 9.25 | 8.53 | 9.03 | 8.98 | 8.91 | 8.07 |
| AT1 | 35.71(15) | 34.97 | 36.13 | 35.21 | 35.02 | 35.48 | 35.37 |
| COX | 5.27(10) | 6.90 | 6.30 | 6.35 | 6.41 | 6.52 | 6.09 |
| D2 | 9.72(100) | 11.45 | 12.53 | 10.61 | 12.53 | 12.21 | 12.61 |
| HIVP | 15.69(5) | 20.26 | 17.90 | 17.61 | 19.57 | 17.32 | 17.72 |
| PKC | 8.70(5) | 9.98 | 11.38 | 12.69 | 12.41 | 12.42 | 9.28 |
| Renin | 51.06(40) | 52.64 | 52.30 | 52.48 | 51.11 | 53.65 | 47.94 |
| SubP | 13.60(50) | 13.93 | 11.64 | 14.00 | 13.89 | 12.47 | 10.67 |
| Thrombin | 9.98(15) | 13.08 | 11.87 | 11.32 | 12.37 | 12.73 | 10.46 |
Results of implementation of the new strategy in ECFC4 fingerprints.
| Activity Class | TSS | R1 | R2 | R3 | R4 | R5 | FR |
|---|---|---|---|---|---|---|---|
| 5HT1A | 8.66 (200) | 10.54 | 10.23 | 9.84 | 10.67 | 10.95 | 10.45 |
| 5HT3 | 10.43 (100) | 12.41 | 13.00 | 13.71 | 13.41 | 12.36 | 11.07 |
| 5HT Reuptake | 7.02 (200) | 8.45 | 7.74 | 7.96 | 7.95 | 8.09 | 7.05 |
| AT1 | 30.45 (40) | 29.43 | 30.30 | 29.74 | 29.96 | 30.58 | 27.09 |
| COX | 6.18 (15) | 6.40 | 6.59 | 6.43 | 6.10 | 6.58 | 5.68 |
| D2 | 8.00 (50) | 9.17 | 9.55 | 9.15 | 10.00 | 9.96 | 9.07 |
| HIVP | 8.69 (200) | 10.96 | 10.69 | 11.19 | 11.33 | 11.06 | 9.11 |
| PKC | 11.43 (5) | 13.46 | 12.72 | 12.45 | 12.42 | 13.00 | 12.62 |
| Renin | 41.74 (50) | 38.83 | 38.42 | 39.14 | 40.33 | 42.05 | 38.76 |
| SubP | 11.73 (200) | 11.92 | 11.92 | 12.29 | 12.10 | 11.39 | 10.53 |
| Thrombin | 6.75 (10) | 8.15 | 8.68 | 8.39 | 8.10 | 8.95 | 7.89 |
Results of implementation of the new strategy in SRECFC4 fingerprints.
| Activity Class | TSS | R1 | R2 | R3 | R4 | R5 | FR |
|---|---|---|---|---|---|---|---|
| 5HT1A | 11.92 (10) | 13.48 | 14.28 | 15.01 | 15.09 | 14.96 | 13.63 |
| 5HT3 | 12.35 (100) | 14.17 | 13.00 | 14.25 | 13.34 | 13.39 | 12.19 |
| 5HT Reuptake | 6.35 (100) | 8.39 | 8.17 | 7.94 | 7.49 | 7.00 | 7.41 |
| AT1 | 34.97 (15) | 36.46 | 37.17 | 37.07 | 37.21 | 36.36 | 37.04 |
| COX | 4.65 (10) | 6.67 | 6.87 | 6.81 | 6.20 | 6.99 | 5.00 |
| D2 | 9.95 (100) | 11.15 | 12.16 | 10.29 | 10.34 | 11.10 | 11.45 |
| HIVP | 17.48 (200) | 21.53 | 21.98 | 20.09 | 20.81 | 22.49 | 18.94 |
| PKC | 12.21 (10) | 14.12 | 14.99 | 14.85 | 14.98 | 13.88 | 13.66 |
| Renin | 48.39 (15) | 48.05 | 48.43 | 46.68 | 47.20 | 46.73 | 47.61 |
| SubP | 12.62 (200) | 13.95 | 13.00 | 14.43 | 13.42 | 13.13 | 11.27 |
| Thrombin | 9.28 (50) | 10.05 | 9.51 | 10.11 | 9.54 | 10.26 | 7.61 |
Inspection on Table 3 indicates that highest recalls were recorded at all layers in different activity classes. For instance, at R1 highest recalls were recorded on the 5HTReuptake, COX, HIVP and Thrombin. At R2, AT1 was recorded to have the highest recall whilst 5HT3, PKC and SubP were the same at R3. R4, R5 and FR had been observed to be favored by 5HT1A, Renin and D2 antagonist with highest recalls, respectively. We also note that there were also cases where the recalls values degraded for three activity classes i.e AT1 at all fusions except R2; SubP at all fusions except R2, R5 and FR; and Renin at FR. Hence, we can order the fusion steps (in descending) based on the number of highest recalls gained as follows; R1(4) > R3(3) > R2 = R4 = R5 = FR(1). This shows that, for ECFP4, the tendency of combined 1st NN result sets (i.e. R1) to give better performance is high as compared to others especially FR. Hence, fusion of top-ranked NN is considered meaningful for binary fingerprint while the steps for fusion of more low-ranked NNs can be exempted.
The pattern observed in ECFC results (Table 4) is the opposite of the ECFP4 fingerprints in terms of the number of highest recall values attained by R1 to R5 in the fourth layer. In ECFC4, low-ranked NN (i.e. the 5th NN) contains four activity classes (5HT1A, AT1, Thrombin, Renin) with highest recall followed by R1 (5HTReuptake, PKC), R3(5HT3, SubP) and R4 (D2, HIVP) with two activity classes each. Whilst at R3 only one activity class (COX) was recorded. Worst recalls were observed for Renin where the new strategy seems not to be able to increase the recall value. Similarly for AT1 class at all fusions except R5; and SubP at R5 and FR. The recall obtained in fifth layer fusion was also below the existing TSS. The ordering based on the number of occurrence in ECFC4 fingerprints is: R5(4) > R1 = R3 = R4(2) > R2(1) > FR(0). Hence, the tendency of the combined low-ranked NN result sets in providing better performance is high in the new strategy. The overall performance of the fourth layer has shown to be better than the final layer. Thus, testing with more low-ranked NNs might have the potential in boosting the performance in this fragment occurrence fingerprint.
For SRECFC4 representation (Table 5), the 2nd and the 5th NNs (i.e. R2 and R5) contain the most number of highest recall values in the eleven activity classes among the group. At R2 three activity classes (D2, PKC, Renin) were noted to have highest recalls. Similarly at R5 where COX, HIVP and Thrombin were observed to have the highest recall. R3 and R4 were recorded to have highest recalls on only two activity classes i.e 5HT3 and SubP; and 5HT1A and AT1, respectively. At R1, only 5HTReuptake was observed to return high recall whilst in the FR fusion only worst recalls were recorded. Other worst recalls were also perceived in Renin except at R2; and SubP, 5HT3 and Thrombin at FR. The order based on the number of highest recall values in SRECFC4 fingerprint is: R2 = R5(3) > R3 = R4(2) > R1(1) > FR(0). This observation indicates that either the combined top-ranked or the low-ranked NNs result sets have the tendency in generating better recall values for this weighted fragment occurrence fingerprint.
4.2. Investigations on the Percentage of Increases (POI) Achieved by the New TSS
As discussed in the previous section, the performance of FR was among the worst where only one highest recall being recorded across the three fingerprints. However, it does not mean that there were no increases being attained by this fusion. In fact after POI was calculated we were able to further analyze the extent of which the new strategy was able to retrieve more active and how effective were the strategies or fusions from one another. Tables 6 to 8 show the POI between the recall values obtained from the new strategy (i.e. R1, R2, R3, R4, R5 and FR) and the existing TSS process. The average of all fusions for each activity classes of this strategy is recorded in the Ave column of each table.
Results of implementation of the new strategy in SRECFC4 fingerprints.
| Activity Class | R1 | R2 | R3 | R4 | R5 | FR | Ave |
|---|---|---|---|---|---|---|---|
| 5HT1A | 3.93 | 10.29 | 11.95 | 12.25 | 6.35 | 11.04 | 9.30 |
| 5HT3 | 7.08 | -5.25 | 8.60 | 0.51 | 3.67 | 0.95 | 2.59 |
| 5HTReuptake | 31.77 | 21.51 | 28.63 | 27.92 | 26.92 | 14.96 | 25.29 |
| AT1 | -2.07 | 1.18 | -1.40 | -1.93 | -0.64 | -0.95 | -0.97 |
| COX | 30.93 | 19.54 | 20.49 | 21.63 | 23.72 | 15.56 | 21.98 |
| D2 | 17.80 | 28.91 | 9.16 | 28.91 | 25.62 | 29.73 | 23.36 |
| HIVP | 29.13 | 14.09 | 12.24 | 24.73 | 10.39 | 12.94 | 17.25 |
| PKC | 14.71 | 30.80 | 45.86 | 42.64 | 42.76 | 6.67 | 30.57 |
| Renin | 3.09 | 2.43 | 2.78 | 0.10 | 5.07 | -6.11 | 1.23 |
| SubP | 2.43 | -14.41 | 2.94 | 2.13 | -8.31 | -21.54 | -6.13 |
| Thrombin | 31.06 | 18.94 | 13.43 | 23.95 | 27.56 | 4.81 | 19.96 |
The percentage of increase between new strategy and existing TSS for ECFC4 fingerprints.
| Activity Class | R1 | R2 | R3 | R4 | R5 | FR | Ave |
|---|---|---|---|---|---|---|---|
| 5HT1A | 21.71 | 18.13 | 13.63 | 23.21 | 26.44 | 20.67 | 20.63 |
| 5HT3 | 18.98 | 24.64 | 31.45 | 28.57 | 18.50 | 6.14 | 21.38 |
| 5HTReuptake | 20.37 | 10.26 | 13.39 | 13.25 | 15.24 | 0.43 | 12.16 |
| AT1 | -3.35 | -0.49 | -2.33 | -1.61 | 0.43 | -11.03 | -3.06 |
| COX | 3.56 | 6.63 | 4.05 | -1.29 | 6.47 | -8.09 | 1.89 |
| D2 | 14.63 | 19.38 | 14.38 | 25.00 | 24.50 | 13.38 | 18.55 |
| HIVP | 26.12 | 23.01 | 28.77 | 30.38 | 27.27 | 4.83 | 23.40 |
| PKC | 17.76 | 11.29 | 8.92 | 8.66 | 13.74 | 10.41 | 11.80 |
| Renin | -6.97 | -7.95 | -6.23 | -3.38 | 0.74 | -7.14 | -5.16 |
| SubP | 1.62 | 1.62 | 4.77 | 3.15 | -2.90 | -10.23 | -0.33 |
| Thrombin | 20.74 | 28.59 | 24.30 | 20.00 | 32.59 | 16.89 | 23.85 |
The percentage of increase between new strategy and existing TSS for SRECFC4 fingerprints.
| Activity Class | R1 | R2 | R3 | R4 | R5 | FR | Ave |
|---|---|---|---|---|---|---|---|
| 5HT1A | 13.09 | 19.80 | 25.92 | 26.59 | 25.50 | 14.35 | 20.88 |
| 5HT3 | 14.74 | 5.26 | 15.38 | 8.02 | 8.42 | -1.30 | 8.42 |
| 5HTReuptake | 32.13 | 28.66 | 25.04 | 17.95 | 10.24 | 16.69 | 21.79 |
| AT1 | 4.26 | 6.29 | 6.01 | 6.41 | 3.97 | 5.92 | 5.48 |
| COX | 43.44 | 47.74 | 46.45 | 33.33 | 50.32 | 7.53 | 38.14 |
| D2 | 12.06 | 22.21 | 3.42 | 3.92 | 11.56 | 15.08 | 11.38 |
| HIVP | 23.17 | 25.74 | 14.93 | 19.05 | 28.66 | 8.35 | 19.98 |
| PKC | 15.64 | 22.77 | 21.62 | 22.69 | 13.68 | 11.88 | 18.05 |
| Renin | -0.70 | 0.08 | -3.53 | -2.46 | -3.43 | -1.61 | -1.94 |
| SubP | 10.54 | 3.01 | 14.34 | 6.34 | 4.04 | -10.70 | 4.60 |
| Thrombin | 8.30 | 2.48 | 8.94 | 2.80 | 10.56 | -18.00 | 2.51 |
For ECFP4 fingerprint, the highest percentage of increase (POI) for the final recall gained at the fifth layer of the new strategy (FR) is 29.73%, which belongs to the D2 antagonists. However, 5HT Reuptake inhibitors own the highest POI in recall value obtained from the top-ranked NN in the fourth layer (R1), where it is equal to 31.77%. The remaining recalls gained at the fourth layer (R2, R3, R4 and R5), possess the highest POI for the same activity class, PKC inhibitors. On the other hand, the highest POI in ECFC4 fingerprints are distributed unevenly, at which the six recalls gained in the new strategy own different activity classes for the highest POI. The highest POI for R1 and R4 resides in HIVP inhibitors, carrying 26.12% and 30.38% respectively; while the highest POI for R2 and R5 locates at Thrombin inhibitors, holding 28.59% and 32.59% respectively. 5HT3 and 5HT1A activity classes are the highest POI for R3 and FR, possessing 31.45% and 20.67% respectively. Lastly, for the SRECFC4 fingerprints, the highest POI is distributed evenly in R1 to R5, whereby the activity class is COX inhibitors, the most structurally diverse group. FR, on the other hand, has 16.69% of POI for the 5HT Reuptake inhibitors.
Overall, an activity class that is more structurally homogeneous is less likely to possess the highest percentage of increase in the implementation of the new strategy. For instance, the activity class, renin inhibitors do not own any highest POI among the three types of fingerprints that had been tested in the experiments. Furthermore, the activity class that owns the highest POI does not necessarily mean the particular class has been increased by highest percentage in the same fingerprint. For FR in SRECFC4 fingerprints, the highest POI belongs to 5HT Reuptake whereas the activity class that increases by the highest percentage is AT1 antagonists.
With the use of ECFP4 fingerprints, the FR from the new strategy has been proven to surpass eight out of eleven activity classes. However, there are seven activity classes that the FR performs better for the ECFC4 and SRECFC4 representations when compared to the recalls gained from the existing TSS method. These findings are found to be related to the structure homogeneity of the dataset (activity class). Hence, the percentage of increase of each results gained was calculated. The percentage of increase achieved in the fourth layer is found to be better than the fifth layer. The higher the percentage of increase, the more effective the new strategy is. Thus, the conclusion made is that more structurally diverse structures are more likely to perform effectively in the new strategy when compared to the performance obtained in the structurally homogeneous group.
Our further inspection on Tables 6 to 8 indicates that on average the new strategy is able to retrieve more actives except for a few classes. The average POI across all activity classes and across all fusions for each ECFP4, ECFC4 and SRECFC4 are 6.19, 11.37 and 13.57, respectively. Thus, we could say that overall, the new strategy using SRECFC4 is able to best retrieve more actives followed by ECFC4 and ECFP4. However, our in depth investigation suggested that the POI recorded by each activity classes at each fusion was not evenly distributed where at some fusions the POI values were very low (near zero) and sometimes negative. Whilst there were also fusions that show a very high increase. Hence, we shall discuss these POIs by looking at the activity classes rather than fusion positions across all fingerprints.
For instance, in the 5HT1A class, we observed that combining lower ranked NN gave the best POI. This could be seen when we ordered the fusions according to descending POI values as follows: ECFP4: R4 > R3 > FR > R2 > R5 > R1; ECFC4: R5 > R4 > R1 > FR > R2 > R3; SRECFC4: R4 > R1 > R5 > R2 > FR > R1. Among the three fingerprints, SRECFC4 was found to have the highest POI ranging from 13.09% to 26.59%. This is followed by ECFC4 (ranging from 13.63% to 26.44%) and ECFP4 (ranging from 3.93% to 12.25%). Based on Table 2, we produced the orderings for all activity classes according to their homogeneity as listed in Table 9. Note that the value in brackets is the range of POI from the lowest to the highest recorded based on the rank. Take the SRECFC4 for 5HT1A as an example where the lowest POI is recorded by R1 (13.63) and highest POI is recorded by R4 (26.59).
The orderings in Table 9 showcase a trend in which higher POI are perceived with heterogeneous rather than homogenous classes. In fact in some of the homogenous classes the POI values are below zero (negative) indicating the failure of retrieving more actives as compared to the ability of the current TSS. These were observed most on the new TSS using ECFC4 where twelve negatives values were identified for Renin, AT1, SubP and COX classes. Similarly in ECFP4, ten records from SubP, AT1, Renin, and 5HT3 classes were observed to have negatives POI. For SRECFC4, only eight of such were noticed at classes of Renin, 5HT3, SubP and Thrombin. In fact, it is clearly visible from Table 9 that the POI range for activity classes of the top (homogenous classes) started with negative values to positive. Often the positive values are either slightly higher than zero or below than 10. Whilst, the range for the bottom activity classes (heterogeneous classes) has a higher start of POI values and its range can reach up to 50% of increase as seen for COX.
The percentage of increase between new strategy and existing TSS for SRECFC4 fingerprints.
| Activity Class | Fusion Order and Range (%) |
|---|---|
| Renin | ECFP4: R5 > R1 > R3 > R2 > R4 > FR (-6.11 - 5.07) ECFC4: R5 > R4 > R3 > R1 > FR > R2 (-7.95 - 0.74) SRECFC4: R2 > R1 > FR > R4 > R5 > R3 (-3.53 - 0.08) |
| AT1 | ECFP4: R2 > FR > R5 > R3 > R4 > R1 (-2.07 - 1.18) ECFC4: R5 > R2 > R4 > R3 > R1 > FR (-11.03 - 0.47) SRECFC4: R4 > R2 > R3 > FR > R1 > R5 (3.97 - 6.41) |
| HIVP | ECFP4: R1 > R4 > R2 > FR > R3 > R5 (10.39 - 29.13) ECFC4: R4 > R3 > R5 > R1 > R2 > FR (4.83 - 30.38) SRECFC4: R5 > R2 > R1 > R4 > R3 > FR (8.35 - 28.66) |
| Thrombin | ECFP4: R1 > R5 > R4 > R2 > R3 > FR (4.81 - 31.06) ECFC4: R5 > R2 > R3 > R1 > R4 > FR (16.89 - 28.59) SRECFC4: R5 > R3 > R1 > R4 > R2 > FR (-10.70 - 14.34)) |
| SubP | ECFP4: R3 > R1 > R4 > R5 > R2 > FR (-21.54 - 2.94) ECFC4: R3 > R4 > R1≈ R2 > R5 > FR (-10.23 - 4.77) SRECFC4: R3 > R1 > R4 > R5 > R2 > FR (-10.70 - 14.34) |
| 5HT3 | ECFP4: R3 > R1 > R5 > FR > R4 > R2 (-5.25 - 8.60) ECFC4: R3 > R4 > R2 > R1 > R5 > FR (6.14 - 31.45) SRECFC4: R3 > R1 > R5 > R4 > R2 > FR (-1.30 - 15.38) |
| 5HT Reuptake |
ECFP4: R1 > R3 > R4 > R5 > R2 > FR (14.96 - 31.77) ECFC4: R1 > R5 > R3 > R4 > R2 > FR (0.43 - 20.37) SRECFC4: R1 > R2 > R3 > R4 > FR > R5 (10.24 - 32.13) |
| D2 | ECFP4: FR > R4 > R2 > R5 > R1 > R3 (9.16 - 29.73) ECFC4: R4 > R5 > R2 > R1 > R3 > FR (13.38 - 25.00) SRECFC4: R2 > FR > R1 > R5 > R1 > R3 (3.42 - 22.21) |
| 5HT1A | ECFP4: R4 > R3 > FR > R2 > R5 > R1 (3.93 to 12.25) ECFC4: R5 > R4 > R1 > FR > R2 > R3 (13.63 to 26.44) SRECFC4: R4 > R1 > R5 > R2 > FR > R1 (13.09 to 26.59) |
| PKC | ECFP4: R3 > R5 > R4 > R2 > R1 > FR (6.67 - 45.86) ECFC4: R1 > R5 > R2 > FR > R3 > R4 (8.66 -17.76) SRECFC4: R2 > R4 > R3 > R1 > R5 > FR (11.88 - 22.77) |
| COX | ECFP4: R1 > R5 > R4 > R3 > R2 > FR (15.56 - 30.93) ECFC4: R2 > R5 > R3 > R1 > R4 > FR (-8.06 - 6.63) SRECFC4: R5 > R2 > R3 > R1 > R4 > FR (9.16 - 50.32) |
On the other hand, looking at the performance of the new TSS according to the fusion layer (i.e. fourth and final layer), we observe that the fusion at the final layer are nearly always less effective as compared of those in fourth layer. For the fourth layer, the best recalls have always been attained by fusing the 5th NN for the ECFC4, 1st NN for ECFP4 and 2nd and 5th NN for SRECFC4. Table 10 shows the analysis on these fusions that happened at the fourth layer (R1 – R5) Since the experiments were carried out by using 5NN in the third layer, 1st NN and 2nd NN are categorized as high-ranked NNs; 3rd NN is the middle-ranked NN; and 4th NN and 5th are the low-ranked NNs. The table also includes the potential of each category (R1 to R5) in increasing the performance of the new strategy either by using top-ranked NN solely or applying with more low-ranked NNs. But still, the performance obtained in the fourth layer is obviously better than those in the fifth layer (i.e. FR). Therefore, regardless the number of NNs being used (i.e. either merely fusing with top-ranked NN or more low-ranked NNs), the experiments in the fourth layer have the potential in boosting the performance of the new strategy when compared to the existing TSS process.
Analysis on the number of highest recalls attained in fourth layer (R1 to R5).
| Structural Representation | Group Having the Highest Recall Values Attained | Better Performance in Top-ranked NN | Better Performance in Low-ranked NN | Increasing Low-ranked NNs might Improve Performance |
|---|---|---|---|---|
| ECFP4 | R1 |  |
||
| ECFC4 | R5 | |
|
|
| SRECFC4 | R2, R5 | |
|
|
4.3. Comparison of the Performance of FR to the Performance of Benchmarked TSS
The difference in recalls percentage (percentage difference) between the new TSS with the existing TSS were calculated for this comparison. For the ECFP4 fingerprints, D2 antagonists gave the best performance when comparing the percentage difference between FR and existing TSS process (i.e. TSS-100 in this case), at which the recall value had been increased by 2.89%. However, the recall value is reduced by 3.12% for the renin inhibitors. Apart from that, for ECFC4 fingerprints, 5HT1A activity class showed the best improvement of performance, whereby the FR had been increased by 1.79% when compared to TSS-200. There was an obvious decrease in percentage for the AT1 antagonists, at which it dropped from 30.45% (TSS-40) to 27.09% (FR), with 3.36% decrement. Nevertheless, in SRECFC4 fingerprints, AT1 antagonists gave 2.07% of increment, which was from 34.97% to 37.04%. This is the best positive percentage difference among other activity classes in the SRECFC4 fingerprints. The worst performance that had been recorded for this type of fingerprint was the thrombin inhibitors. The particular activity class had decreased by 1.67%, which was from the recall value of existing TSS with 50 NNs, 9.28% to the FR gained at the fifth layer, 7.61%.
The occurrences of percentage difference (i.e. some activity classes showed a positive increment and some indicated a negative decrement) are believed to relate to the homogeneity of the activity class. The ordering (in decreasing) for the difference between the recall gained from the final layer of the new strategy and the recall value obtained from the existing TSS process for the three types of fingerprints tested are:
ECFP4: D2 > HIVP > 5HT1A > 5HTReuptake > COX > PKC > Thrombin > 5HT3 > AT1 > SubP > Renin
ECFC4: 5HT1A > PKC > Thrombin > D2 > 5HT3 > HIVP > 5HTReuptake > COX > SubP > Renin > AT1
SRECFC4 : AT1 > 5HT1A > D2 > HIVP > PKC > 5HTReuptake > COX > 5HT3 > Renin > SubP > Thrombin
Overall, the ordering shows that if the molecules are structurally homogeneous, there is no obvious increase in the performance of FR in the new strategy when compared to the recall value in the existing TSS process. Based on the experiments conducted, renin inhibitors did not increase the performance most likely due to the structures of renin that are more homogeneous in nature. On the contrary, the structures that are structurally diverse are more likely to increase the performance of the new TSS process. In other words, the structures which are more diverse in nature tend to perform better in the final layer of the new strategy than the existing process. For instance, the activity classes, 5HT1A and PKC had shown an increment in the recall value gained through the experiments of all the three types of fingerprints (i.e. ECFP4, ECFC4 and SRECFC4) in the new strategy. That claim can be made based on the observation that more homogeneous groups tend to be less likely in providing better performance in the new strategy.
5. THE SIGN TEST ON FULL RESULTS
In order to test the significance of the significance of the results gained in the implementation of the new strategy, this section will discuss the sign test based on each activity class for the three different fingerprints.
5.1. The Sign Test Based on Activity Class
In this case, the two samples used were the results of new strategy and the results of the existing TSS process. This section is the continuation of the sign test from initial results. The evaluation can be said as activity class-based because the samples being compared were based on the recall values obtained for each activity class on the different set of fingerprints.
The sign test began with a null hypothesis, H0 which stated that the new strategy has the same performance as the existing TSS method. In other words, the new strategy does not boost up the performance of the existing TSS process. The alternative hypothesis, H1 stated that the new strategy outperforms the existing strategy. The size of the samples, N was equal to six because there were six recalls values (i.e. R1, R2, R3, R4, R5 and FR) to be compared for each activity class in the three types of fingerprints. Since N was less than 35, the significance level, α is set to 0.05.
Table 11 demonstrates the above-mentioned on the recalls of the new TSS using ECFP4 fingerprints for 5HT1A class. The number of positive sign was calculated based on the number of positive values gained after deducting the recall value obtained in existing TSS from the recalls gained in the new strategy in a particular activity class based on Tables 4 to 6. The probability was computed based on the number of positive sign gained. If the value of the probability was less than α, the dataset was considered as significant and H1 is accepted. On the contrary, H0 is accepted if the probability was higher than 0.05 and the dataset was said to be not significant.
Tables 12 to 14 show the results gained after the significance testing for the three fingerprints based on the concept shown in Table 11. According to Table 12, there are seven activity classes (i.e. 5HT1A, 5HTReuptake, COX, D2, HIVP, PKC and Thrombin) which accepted H1. This is because the value of probability is less than the significance level. However, the activity classes that are not so significant in this case are 5HT3, Renin, SubP and AT1. These four types of classes are categorized under the structurally homogeneous group (refer to Table 2). Hence, it can be said that the results gained in the new strategy tend to be more significant for the structures that are more diverse in nature for the binary representations.
The sign table based on recalls of the New TSS using ECFP4 for 5HT1A activity class.
| Recalls from New Strategy | Recall from Existing TSS (TSS-20) |
Direction of Difference | Sign |
|---|---|---|---|
| 13.74 (R1) | 13.22 | R1 > TSS-20 | + |
| 14.58 (R2) | 13.22 | R2 > TSS-20 | + |
| 14.80 (R3) | 13.22 | R3 > TSS-20 | + |
| 14.84 (R4) | 13.22 | R4 > TSS-20 | + |
| 14.06 (R5) | 13.22 | R5 > TSS-20 | + |
| 14.68 (FR) | 13.22 | FR > TSS-20 | + |
For ECFC4 fingerprints, the number of activity classes showing significant results is seven, including 5HT1A, 5HT3, 5HTReuptake, D2, HIVP, PKC and Thrombin, as shown in Table 13. All of these seven classes proved that the results gained in the new strategy are significant and hence it boosted up the performance of the existing TSS process. However, there are four activity classes that do not show significant results, whereby COX belongs to structurally diverse group and the other three classes are categorized in more homogeneous groups. Therefore, the significant level for the ECFC4 fingerprint is in the intermediate, which is either homogeneous or diverse groups, both have the potential in providing significant and also non-significant results.
The sign test based on activity class for ECFP4 fingerprints.
| Activity Class | Number of Positive Sign (i) | Probability P[x > i] |
Hypothesis Accepted | Significant |
|---|---|---|---|---|
| 5HT1A | 6 | 0.015625 | H1 | Yes |
| 5HT3 | 5 | 0.109375 | H0 | No |
| 5HTReuptake | 6 | 0.015625 | H1 | Yes |
| AT1 | 1 | 0.984375 | H0 | No |
| COX | 6 | 0.015625 | H1 | Yes |
| D2 | 6 | 0.015625 | H1 | Yes |
| HIVP | 6 | 0.015625 | H1 | Yes |
| PKC | 6 | 0.015625 | H1 | Yes |
| Renin | 5 | 0.109375 | H0 | No |
| SubP | 3 | 0.656250 | H0 | No |
| Thrombin | 6 | 0.015625 | H1 | Yes |
Table 14 shows the significance test for SRECFC4 fingerprints based on activity classes. The activity classes that accepted the new strategy performing better than the existing method are 5HT1A, 5HTReuptake, AT1, COX, D2, HIVP and PKC. These seven classes can be considered as the structurally diverse group, which means diverse groups are more likely to provide significant results than the homogeneous structures. The sign test based on activity classes in the three different types of fingerprints are clearly shown in Fig. (6). The probability values less than the significance level (below the red line) are considered as significant results.
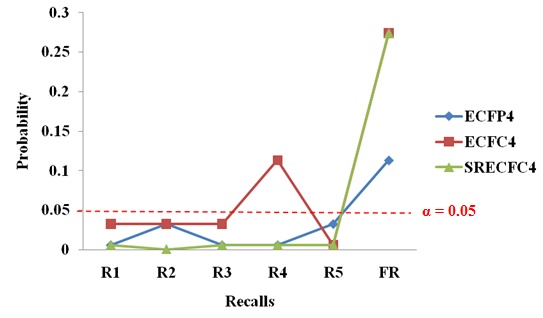 |
Fig. (6). The Sign Test based on Activity Class across Different Fingerprints. |
Overall, the three types of structural representations consist of seven activity classes that are showing significant results and have accepted the statement that the new strategy has a better performance than the existing TSS method. In other words, 63.64% ((7/11) × 100%) of results generated in the new strategy are significant in all the three fingerprints that had been tested. The structures that are more diverse in nature are more likely to generate statistically significant results.The alternative hypothesis accepted is most probably true and it had not occurred by chance.
The sign test based on activity class for ECFC4 fingerprints.
| Activity Class | Number of Positive Sign (i) | Probability P[x > i] |
Hypothesis Accepted | Significant |
|---|---|---|---|---|
| 5HT1A | 6 | 0.015625 | H1 | Yes |
| 5HT3 | 6 | 0.015625 | H1 | Yes |
| 5HTReuptake | 6 | 0.015625 | H1 | Yes |
| AT1 | 1 | 0.984375 | H0 | No |
| COX | 4 | 0.343750 | H0 | No |
| D2 | 6 | 0.015625 | H1 | Yes |
| HIVP | 6 | 0.015625 | H1 | Yes |
| PKC | 6 | 0.015625 | H1 | Yes |
| Renin | 1 | 0.984375 | H0 | No |
| SubP | 4 | 0.343750 | H0 | No |
| Thrombin | 6 | 0.015625 | H1 | Yes |
The sign test based on activity class for SRECFC4 fingerprints.
| Activity Class | Number of Positive Sign (i) | Probability P[x > i] |
Hypothesis Accepted | Significant |
|---|---|---|---|---|
| 5HT1A | 6 | 0.015625 | H1 | Yes |
| 5HT3 | 5 | 0.109375 | H0 | No |
| 5HTReuptake | 6 | 0.015625 | H1 | Yes |
| AT1 | 6 | 0.015625 | H1 | Yes |
| COX | 6 | 0.015625 | H1 | Yes |
| D2 | 6 | 0.015625 | H1 | Yes |
| HIVP | 6 | 0.015625 | H1 | Yes |
| PKC | 6 | 0.015625 | H1 | Yes |
| Renin | 1 | 0.984375 | H0 | No |
| SubP | 5 | 0.109375 | H0 | No |
| Thrombin | 5 | 0.109375 | H0 | No |
5.2. The Sign Test Based on Recall Values
The sign test in this section was conducted based on the recall value from the existing TSS and the six recalls gained in the new strategy. Each of the six recalls underwent the sign test separately in this case. This evaluation can also be referred to as recall value-based, which is the opposite of Section 5.1.
At first, the null hypothesis, H0 stated that both R1 and existing TSS have the same performance, which means R1 gained in the new strategy do not generate higher recall value. However, the alternative hypothesis, H1 mentioned that R1 has a better performance than the existing TSS. The term of R1 in both the hypothesis kept on changing depending on the recalls being compared (i.e. R2, R3, R4, R5 and FR). The size of the samples, N was equal to eleven, as there were eleven results for each of the recalls (i.e. R1 to FR) gained from the new strategy across the three different structural representations. The significance level, α will be set at 0.05 since N was less than 35.
Table 15 demonstrates the sign table that acted as the concept in generating Tables 16 to 18, the results of the sign test based on the recall values for the three fingerprints being tested. According to Table 11, the number of positive sign is calculated based on the number of R1 exceeds the recalls from the existing TSS process. For the dataset with the number of positive sign greater than or equal to nine, the results gained from the new strategy are said to be significant.
The sign table based on the recall values.
| Activity Class | Recalls from New Strategy (R1) | Recall from Existing TSS | Direction of Difference | Sign |
|---|---|---|---|---|
| 5HT1A | 13.74 | 13.22 (20) | R1 > TSS-20 | + |
| 5HT3 | 16.94 | 15.82 (100) | R1 > TSS-100 | + |
| 5HT Reuptake |
9.25 | 7.02 (10) | R1 > TSS-10 | + |
| AT1 | 34.97 | 35.71 (15) | R1 < TSS-15 | - |
| COX | 6.90 | 5.27 (10) | R1 > TSS-10 | + |
| D2 | 11.45 | 9.72 (100) | R1 > TSS-100 | + |
| HIVP | 20.26 | 15.69 (5) | R1 > TSS-5 | + |
| PKC | 9.98 | 8.70 (5) | R1 > TSS-5 | + |
| SubP | 52.64 | 51.06 (40) | R1 > TSS-40 | + |
| Renin | 13.93 | 13.60 (50) | R1 > TSS-50 | + |
| Thrombin | 13.08 | 9.98 (15) | R1 > TSS-15 | + |
According to Table 16, all of the recall values gained at the fourth layer of the new strategy are better than the existing TSS method, whereby the recall values are higher. The recalls obtained in the new strategy are said to be statistically significant in ECFP4 fingerprint except the recalls gained at the fifth layer (FR). R1, R3 and R4 are more significant than R2 and R5 as the values of the probability are lower when compared to the significance level, which is 0.05.
For ECFC4 fingerprint (Table 17), R1, R2, R3, R4 and R5 generated significant results. However, among the recalls gained at the fourth layer, R5 shows the most significant results, which indicated that low-ranked NN performed better than the high-ranked NN in the ECFC4 fingerprints. Hence, there is a potential in taking more low-ranked NN in ECFC4 in order to generate more significant results. The recalls gained at the final layer still did not provide significant results.
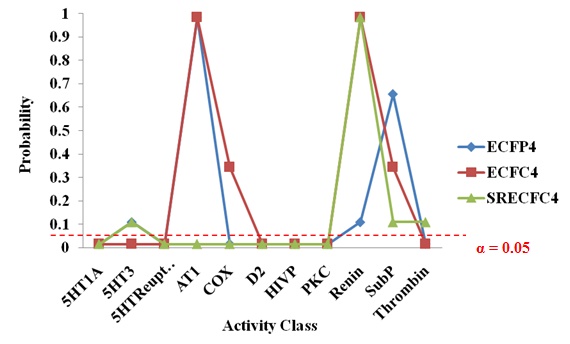 |
Fig. (7). The sign test based on recalls across different fingerprints. |
Table 18 shows that FR gained at the fifth layer for SRECFC4 did not produce significant results when it was compared to the recalls of the existing TSS. The significance level is distributed evenly among R1 to R5 when compared to ECFP4 and ECFC4 fingerprints. All of the recalls at fourth layer did provide significant results, at which it is also agreeing that the new strategy has better performance than the existing TSS process. It is believed that retrieving top-ranked or more low-ranked NNs also contributed in generating significant results in the SRECFC4 fingerprints.
The sign test based on recalls for ECFP4 fingerprints.
| Recall | Number of Positive Sign (i) | Probability P[x >i] |
Hypothesis Accepted | Significant |
|---|---|---|---|---|
| R1 | 10 | 0.005859375 | H1 | Yes |
| R2 | 9 | 0.032714843 | H1 | Yes |
| R3 | 10 | 0.005859375 | H1 | Yes |
| R4 | 10 | 0.005859375 | H1 | Yes |
| R5 | 9 | 0.032714843 | H1 | Yes |
| RF | 8 | 0.113281250 | H0 | No |
The sign test based on recalls for ECFC4 fingerprints.
| Recall | Number of Positive Sign (i) | Probability P[x >i] |
Hypothesis Accepted | Significant |
|---|---|---|---|---|
| R1 | 9 | 0.032714843 | H1 | Yes |
| R2 | 9 | 0.032714843 | H1 | Yes |
| R3 | 9 | 0.032714843 | H1 | Yes |
| R4 | 8 | 0.113281250 | H0 | No |
| R5 | 10 | 0.005859375 | H1 | Yes |
| FR | 7 | 0.274414062 | H0 | No |
The sign test based on recalls for SRECFC4 fingerprints.
| Recall | Number of Positive Sign (i) | Probability P[x >i] |
Hypothesis Accepted | Significant |
|---|---|---|---|---|
| R1 | 10 | 0.005859375 | H1 | Yes |
| R2 | 11 | 0.000488281 | H1 | Yes |
| R3 | 10 | 0.005859375 | H1 | Yes |
| R4 | 10 | 0.005859375 | H1 | Yes |
| R5 | 10 | 0.005859375 | H1 | Yes |
| FR | 7 | 0.274414062 | H0 | No |
As a whole, R1 to R5 (recalls at the fourth layer) generated significant results in all the three types of fingerprints, as shown in Fig. (7). Results at the fourth layer are more significant than results at the fifth layer as the FR (fifth layer’s results) only provide nearly significant results. Hence, there is no useful meaning in adding the final layer to the new strategy as the recalls gained at the fourth layer have already shown statistically significant results. The results at the fourth layer did not solely occur due to chance.
CONCLUSION
The implementation of new strategy has demonstrated that there had been an increment in the recall performance when compared to the existing TSS strategy. The recall values obtained in the new strategy were higher than the existing method, indicating that the new strategy is worth implementing and it can be further tested with other combination sets of the main elements used (i.e. structural representations, similarity coefficients, fusion rules and number of nearest neighbors used). The new strategy had a better performance than the existing TSS strategy in every activity class using the three different fingerprints (ECFP4, ECFC4 and SRECFC4) that were being tested in the experiments. The new strategy also showed a higher percentage of increase for activity classes that are structurally diverse and contrastingly lower percentage of increase for groups that are structurally homogeneous. The sign test also proved that the results obtained is significant (probably true) and not due to chance. The recalls gained at the fourth layer were more significant than the recalls obtained in the fifth layer of the new strategy implemented.
CONFLICT OF INTEREST
The authors confirm that this article content has no conflict of interest.
ACKNOWLEDGEMENTS
We would like to thank Universiti Sains Malaysia for providing facilities and funding.