RESEARCH ARTICLE
Water Soluble Chitosan Mediated Voriconazole Microemulsion as Sustained Carrier for Ophthalmic Application: In vitro/Ex vivo/In vivo Evaluations
Rohit Bhosale1, Omkar Bhandwalkar1, Anita Duduskar1, Rahul Jadhav2, Pravin Pawar*, 1
Article Information

Identifiers and Pagination:
Year: 2016Volume: 3
First Page: 215
Last Page: 234
Publisher Id: PHARMSCI-3-215
DOI: 10.2174/1874844901603010215
Article History:
Received Date: 01/07/2016Revision Received Date: 08/09/2016
Acceptance Date: 28/09/2016
Electronic publication date: 29/12/2016
Collection year: 2016
open-access license: This is an open access article licensed under the terms of the Creative Commons Attribution-Non-Commercial 4.0 International Public License (CC BY-NC 4.0) (https://creativecommons.org/licenses/by-nc/4.0/legalcode), which permits unrestricted, non-commercial use, distribution and reproduction in any medium, provided the work is properly cited.
Abstract
Background:
Voriconazole (VCZ) is a lipophilic candidate, effective against fungal infections like ocular keratitis and endopthalmitis.
Objective:
The purpose to develop, optimize and characterize voriconazole microemulsion as sustained medication for ophthalmic application.
Methods:
The pseudo-ternary phase diagrams were developed using oleic acid, isopropyl myristate and isopropyl palmitate (oil phases), tween 80 (surfactant), propylene glycol (co-surfactant), distilled water (aqueous phase) and modified chitosan (Mod.CH) as mucoadhesive polymer. The optimum composition of oil, Smix and water was selected on the basis of phase diagrams and as mucoadhesive polymer Mod.CH was used in the formulations. All the formulations were evaluated for thermodynamic stability/dispersibility, physicochemical parameters (droplet size, polydispersity index, zeta potential, drug content, viscosity, pH and conductivity), in vitro, ex vivo and in vivo studies.
Results:
All formulations showed droplet size below 250 nm, positive zeta potential and polydispersity index below 0.5. The in vitro drug release study performed on selected formulations showed maximum sustained release than marketed formulation. The in vitro transcorneal permeation experiment of formulations suggests that optimized formulations showed better permeation. The selected formulation of voriconazole microemulsion was able to produce maximum antifungal activity against Candida albicans when compared to marketed formulation. In vivo study performed on rabbit eyes, found more drug concentration in aqueous humor of optimized formulation; the AUC0→t of IPMVM-11 was approximately 6.84-fold higher than VOZOLE and efficiently enhanced the corneal bioavailability.
Conclusion:
The modified chitosan based on voriconazole loaded microemulsion was promising novel carrier for sustained action in ophthalmic medication.
1. INTRODUCTION
Many novel strategies have been developed to overcome the disadvantages with the conventional ophthalmic preparations as in the form of controlled ocular drug delivery. Among the conventional dosage forms such as solutions, suspensions and ointments account for almost 90% of the currently available ophthalmic formulations on the market. They offer some advantages such as their ease of administration by the patient, ease of preparation and low production costs. When application of eye drop in eye, it mixes with tear fluid within five minutes and majority of drug eliminated from eye due to the tear turn over. Other than this, sometimes, factors which contribute to drug elimination like nasolacrimal drainage, conjuctival uptake due to poor bioavailability, and less residence time, result in about less than 5% of applied drug penetrating the cornea and reaching the intraocular tissues. Topical absorption of drug towards eye is challenging and complicated because of distinctive anatomy physiology of eye. The corneal barrier acts as rate limiting agent for the absorption of many drugs [1, 2].
Relevant information regarding factors affecting drug permeation or retention as well as anatomy and physiology of eyes can be found in several literatures. From a therapeutic approach, lipid emulsions for ocular application aim to improve drug bioavailability either by providing prolonged residence time on eye or by facilitating transcorneal/transconjunctival penetration. Drugs incorporated in o/w type lipid emulsions are lipophilic in nature and, depending on the extent of lipophilicity, either the corneal or the conjunctival/sclera route of penetration may be favoured. For more lipophilic drugs, the corneal route was shown to be the predominant pathway for delivering drugs to the iris, whereas the less lipophilic drugs underwent the conjunctival/scleral penetration for delivery into the ciliary body. Thus, transcorneal permeation has conventionally been the mechanism by which the drug is topically applied [3].
The volume of human cul-de-sac contain 30µl and the volume of most eye drop dispensers is approximately 50µl, thus large proportion of drug wasted due to excess volume, until the tears retain to their normal volume 7µl remains in cul-de-sac of eye [4].
So it is necessary to maintain drug concentration in eye for longer time to achieve maximum therapeutic benefit to reduce the drawbacks associated with conventional dosage forms such as solutions, suspensions, ointments, gels, inserts, etc. Thus, nowadays researchers focus on R and D based novel strategies. The colloidal dosage forms, such as microparticles/nanoparticles, liposomes, niosomes, solid lipid nanoparticles (SLNs), microemulsions(MEs)/ nanoemulsions etc. act as drug reservoirs and can prolong precorneal time of drug on cornea [5].
Microemulsion (ME) is defined as a dispersion consisting of oil, surfactant, co-surfactant and aqueous phase, which is a single optically isotropic and thermodynamically stable liquid solution with diameter usually in nanosize (20-200nm). Furthermore, ME can accommodate both hydrophilic and lipophilic drugs including those drugs which are insoluble in hydrophilic as well as lipophilic solvents. The poorly water soluble drug incorporates in oil phase to prolong the release of drug from ME. A co-surfactant may also be used to increase the fluidity of the interfacial membrane and help in minimising the interfacial tension to form a stable microemulsion. In the last decade, oil-in-water (o/w) type lipid emulsions, primarily intended for parenteral applications have been investigated and are now exploited commercially as a vehicle to improve the ocular bioavailability of lipophilic drugs. Microemulsions are particularly useful for ocular delivery of lipophilic drugs, as the lipid content allows the lipophilic drug to be solubilized, stable and available for therapeutic activity, while the aqueous phase minimises blurring of vision. To optimize drug solubility, a mixture of oils and surfactants may be used [6, 7].
The antifungal drug choice of newer triazole i.e. voriconazoleis a novel second generation triazole derivative of fluconazole with excellent broad spectrum activity commercially available as lyophilizedpowder for intravenous, eye drop and for oral film coated tablets, powder for suspension.Voriconazole has broad in vitro antifungal activity against yeasts and moulds, including a broad range of less common pathogens. Voriconazole possess fungicidal in vitro activity against all Aspergillus species, moulds such as Scedosporium species and Fusarium species and is highly potent against fluconazole-resistant Candida species including Candida krusei, Candida glabrata and Candida albicans. The minimum inhibitory concentrations (MICs) of voriconazole are considerably less than that of fluconazole. It inhibits cytochrome P450–dependent 14α sterol demethylase enzyme which is responsible for inhibiting and disrupting fungal cell membrane synthesis, resulting in depletion of ergosterol [8].Voriconazole marketed formulations are also present namely, voriconazole is a lyophilized powder (VOZOLE (1% w/v)) and voriconazole (VCZ injection 1 mg/vial, lyophilized powder).Voriconazole is a lipophilic drug with a low pH dependent aqueous solubility (maximum 2.7mg/ml at pH 1.2).
Among the available approaches, chitosan based microemulsion drug delivery system for eye are used to improve prolong drug contact time over ocular mucosa or to increased the penetration of drug towards aqueous humor which reach in blood vessels and ultimately responsible for maximum bioavailability. The characteristics of chitosan such as biodegradability, non-toxicity, biocompatibility and mucoadhesiveness, the primary hydroxyl and amine groups present on the backbone of chitosan are responsible for reactivity of polymer and also act as site for modification. However chitosan has certain limitations can be overcome by chemical modification to control its physical properties [9].
Taking above information in view, the aim of present investigation was to formulate voriconazole loaded microemulsion by using optimum concentration of oil and Smix (surfactant:co-surfactant) with mucoadhesive polymer like modified chitosan (Mod. CH) for ophthalmic application.
2. MATERIALS AND METHODS
2.1. Materials
Voriconazole (VCZ) was received as gift sample from matrix laboratories, (Hyderabad, India), modified chitosan (water soluble 90%w/v) (Mod.CH) were procured from sea food (India), tween 80 (T80), propylene glycol (PG), cotton seed oil, isopropyl myristate (IPM), isopropyl palmitate (IPP), castor oil, oleic acid (OA), olive oil, soya oil, cod liver oil, polyethylene glycol (PEG 200), polyethylene glycol (PEG 400) and plurololeique were purchased from sigma-aldrich Pvt. Ltd., (India). Dialysis membrane (MW cut-off 12000-14000 A°) was purchased from HiMedia Laboratories (Mumbai, India). All other chemicals used of analytical reagent grade. Fresh whole eyeballs of goat were obtained from local butcher’s shop (Bhuinj, Satara, India) within one hour of slaughtering of animal.
2.2. Experimental
2.2.1. HPLC Study of VCZ
The analysis of VCZ was carried out by using a reversed phase HPLC method. The HPLC (Shimadzu, Kyoto, Japan) instrument was equipped with a model series; pump LC-10 ADVP, system controller SCL-10 AVP, A Degasser DGU-12, Rheodyne 7725i injector with a 20 µl loop and a SPD-10 AVP ultraviolet/visible detector. Separation and quantitation were made on a C18 reverse phase (250 mm × 4.6 mm (internal diameter), 5 µm Inertsil ODS-3) column that was operated at 40°C. The mobile phase comprises a mixture of methanol and 0.1% acetic acid (pH 4) in the ratio of 70:30 (v/v),which was run at a flow rate of 1.0 ml/min. The eluents were analyzed spectrophotometrically at 255 nm and an injection volume of 20 µl. The retention time of VCZ was obtained at 5.50 min. The method developed was validated for linearity, precision and accuracy. The method was validated presenting a linear calibration curve(r = 0.999; y = 18.065x + 12.421) over a drug concentration range of 0.4–400.0 µg/ml. For precision (inter- and intra-day), the relative standard deviation was found below 2% while the % recovery (accuracy) was found between 98.77 and 99.57%. Limit of detection (LOD) and limit of quantitation (LOQ) was found as 0.1 and 0.4 µg/ml respectively.
2.2.2. Preparation of Microemulsion
2.2.2.1. Screening of Excipients (Selection of Oils, Surfactant and Co-surfactant)
The solubility of voriconazole in various oils (cotton seed oil, isopropyl myristate, isopropyl palmitate, castor oil, oleic acid, olive oil, soya oil, cod liver oil), surfactants (tween 80, span 80), co-surfactants (propylene glycol, PEG 200, PEG 400, plurololeique) was determined by dissolving an excess amount of voriconazole in 2 ml of each selected oils, surfactants, co-surfactants stirred at 100 rpm for 72 hours to achieve equilibrium then suspension was centrifuged using centrifuge (Bio Era, Mumbai, India) at 3000 rpm for 15 min. The supernatant was taken and filtered through 0.45 µm membrane filter (whatmann) [10, 11]. The concentration of voriconazole was determined in each oil, surfactant and co-surfactant by double beam UV/Visible spectrophotometer (Labindia, Mumbai, India) at their particular wavelength 255 nm. On the basis of result, it was found that oleic acid, isopropyl myristate and isopropyl palmitate consumed maximum amount of voriconazole thus chosen as a vehicle for microemulsion than other oils.
2.2.2.2. Construction of Pseudo-Ternary Phase Diagram (Phase Behavior)
In order to find out concentration range of components for the existence range of microemulsion, pseudo-ternary diagram were constructed using tween 80 to propylene glycol by water titration method at ambient temperature (25°C). Weight ratios i.e. 1:1 and 2:1 were considered while constructing pseudo-ternary phase diagram. For each two phase diagram, each oil phase (oleic acid, isopropyl myristate, isopropyl palmitate) to amount of Smix (tween 80 and propylene glycol) were mixed at ratio of 1:9, 2:8, 3:7, 4:6, 5:5, 6:4, 7:3, 8:2, 9:1 respectively. The mixture of oil, surfactant and co-surfactant at weight ratios were diluted with dropwise addition of distilled water, under moderate magnetic stirring (Remi Equipments Pvt. Ltd. Mumbai, India). After being equilibrated, the mixtures were assessed visually for clear/transparent, single phase, low viscous and flowable o/w microemulsions [12, 13]. The pseudo-ternary phase diagrams were constructed using CHEMIX (CHEMIX School version 3.5) software.
2.2.2.3. Preparation of Voriconazole Loaded Microemulsions
For selection of MEs from preliminary batches, the phase diagram regions were recognized. VCZMEs were prepared by addition of 0.1% w/v (1 mg/ml) voriconazole in mixtures of each oil, surfactant, co-surfactant with varying component ratio and an appropriate amount of water was added to mixture drop by drop and the microemulsion containing voriconazole was obtained by stirring the mixture using magnetic stirrer (RemiEquipmentsPvt. Ltd. Mumbai, India) at 25°C at 100 rpm [12].Various batches of microemulsions were prepared by water titration method and optimization was done in terms of thermodynamic stability/dispersibility, clarity, droplet size, viscosity studies.
2.2.2.4. Preparation of Modified Chitosan Based VCZMEs (Mod.CH-VCZMEs)
The selected microemulsion formulations were imparted with mucoadhesive characteristics by using optimized modified chitosan solution. In brief, the selected formulations in their optimized Smix ratios(1:1 and 2:1) along with optimized oil to Smix ratios were titrated against the Mod.CH (0.25% w/v) solution in distilled water. As different composition ratio, described in Table 1. The Mod.CH (0.25% w/v)dispersion added dropwise to mixture of VCZ (0.1% w/v) containing optimized Smix and oil ratio and stirred under magnetic stirrer (Remi Equipments Pvt. Ltd. Mumbai, India) at 25°Cat 100 rpmfor 2 hours [12].
| Phase diagram | Batch code |
VCZ (% w/v) |
Modified chitosan (% w/v) |
Oils (% w/w) |
Smix (% w/w) T80: PG |
Water (% w/w) |
|||
|---|---|---|---|---|---|---|---|---|---|
| OA | IPM | IPP | 1:1 | 2: 1 | |||||
| A | OAVM-1 | 0.1 | 0.25 | 5 | - | - | 50 | - | 45 |
| OAVM-2 | 0.1 | 0.25 | 5 | - | - | 55 | - | 40 | |
| OAVM-3 | 0.1 | 0.25 | 5 | - | - | 60 | - | 35 | |
| B | OAVM-4 | 0.1 | 0.25 | 5 | - | - | - | 45 | 50 |
| OAVM-5 | 0.1 | 0.25 | 5 | - | - | - | 50 | 45 | |
| OAVM-6 | 0.1 | 0.25 | 5 | - | - | - | 55 | 40 | |
| C | IPMVM-7 | 0.1 | 0.25 | - | 5 | - | 35 | - | 60 |
| IPMVM-8 | 0.1 | 0.25 | - | 5 | - | 40 | - | 55 | |
| IPMVM-9 | 0.1 | 0.25 | - | 5 | - | 45 | - | 50 | |
| D | IPMVM-10 | 0.1 | 0.25 | - | 5 | - | - | 35 | 60 |
| IPMVM-11 | 0.1 | 0.25 | - | 5 | - | - | 40 | 55 | |
| IPMVM-12 | 0.1 | 0.25 | - | 5 | - | - | 45 | 50 | |
| E | IPPVM-13 | 0.1 | 0.25 | - | - | 5 | 35 | - | 60 |
| IPPVM-14 | 0.1 | 0.25 | - | - | 5 | 40 | - | 55 | |
| IPPVM-15 | 0.1 | 0.25 | - | - | 5 | 45 | - | 50 | |
| F | IPPVM-16 | 0.1 | 0.25 | - | - | 5 | - | 35 | 60 |
| IPPVM-17 | 0.1 | 0.25 | - | - | 5 | - | 40 | 55 | |
| IPPVM-18 | 0.1 | 0.25 | - | - | 5 | - | 45 | 50 | |
2.2.3. Characterization of Voriconazole Loaded Microemulsions
The developed mucoadhesive microemulsion were further characterized for thermodynamic stability/dispersibility,droplet size and zeta potential, polydispersity index, drug content, pH, viscosity, conductivity, in vitro drug release, ex vivo permeation, antifungal activity and in vivo studies.
2.2.3.1. Thermodynamic Stability/Dispesibility Studies
Microemulsions are thermodynamically stable systems and formed at particular composition (concentration) of oil, surfactant, co-surfactant and water. In addition no creaming or cracking and phase separation as compared to regular emulsion have kinetic stability results ultimately phase separates, thus selected regions of microemulsions also characterized to prove thermodynamic stability. The microemulsion formulations subjected to stress tests like heating cooling cycle, centrifugation, freeze thaw cycle, those formulations passed these stress tests were subjected to dispersibility test [14, 15].
2.2.3.1.1. Heating Cooling Cycle
The prepared microemulsion formulations are subjected to six cycles between refrigerator temperature 4°C and 45°C with storage at each temperature not less than 48 hours were studied. Those formulations, which were stable at these temperatures, were subjected to centrifugation test.
2.2.3.1.2. Centrifugation
The passed formulations from heating cooling cycles were centrifuged using centrifuge (Bio Era, Mumbai, India) at 3500 rpm for 30 min. Those formulations which did not show any phase separation were taken for the freeze thaw stress test.
2.2.3.1.3. Freeze Thaw Cycle
After centrifugation selected formulations subjected to three freeze thaw cycles between −18°C and +25°C with storage at each temperature not less than 48 hours was done for the formulations. Those formulations, which passed these thermodynamic stress tests, were further taken for the dispersibility test for assessing the efficiency of self-emulsification. The formulations were observed visually for any phase separation or any colour change.
2.2.3.1.4. Dispersibility Test
After all above mentioned three tests, the selected formulations were subjected to dispersibility tests used to assesses self-emulsification of formulation. From the formulations 1 ml of each added to 500 ml of water at 37°C ± 0.5°C. The appearances and emulsification rates graded visually [15].The following grading systems used to appearances assess visually such as grade A for rapidly forming (within 1 min.) microemulsion, having a clear or bluish white appearance, grade B for rapidly forming and slightly less clear microemulsion having bluish appearance, grade C for fine milky microemulsion that formed within 2 min., grade D for gradual and grayish white appearance, grade E for gradual with the presence large globules.
2.2.3.2. Drug Content (%) Assay
The drug content (%) of microemulsion was determined by dissolving required quantity (2 ml) of MEs (equivalent to 2 mg VCZ) in mixture of methanol/water. After suitable dilutions with methanol and distilled water, absorbance was determined using double beam UV/Visible spectrophotometer (Lab India, Mumbai, India) keeping blank microemulsion at wavelength 255 nm [15].
2.2.3.3. Fourier Transform Infrared Spectroscopy (FTIR) Analysis
FTIR studies were performed todetermine the compatibility study between drug and other components of microemulsions (oil, surfactant/co-surfactant and Mod.CH) by KBR dispersion method considering % transmittance of FTIR spectrophotometer (IRAffinity1, Shimadzu, Japan). The base line correction was completed using dried potassium bromide and % transmittance analyzed at in the spectral region of 4000-400 cm-1 using a resolution of 4 cm-1 and 40 cm-1 scans [13].
2.2.3.4. Droplet Size, Zeta Potential and Polydispersity Index Measurements
The droplet size, zeta potential and polydispersity index (PDI) of the MEs was determined by photon correlation spectroscopy (PCS) (which analyzes the fluctuations in light scattering due to browning motion of the particles) with a Nano sizer SZ-100 (Horiba nano size analyzer, Japan) able to measure sizes between 10-3000 nm. Light scattering was monitored at 25°C at 90°angles. The dispersed formulations were measured after dilution (1:100) i.e. 1ml formulation was dispersed in 100 ml distilled water to produce the required count rate (50-200) to enable accurate measurement. All the analysis was repeated in triplicate [16].
2.2.3.5. Viscosity Measurement Study
The viscosity of all microemulsions was determined without dilution using Fungilab viscometer (Fungilab expert series serial EXPL 3000050, code V300003, Spain) using spindle no.L3 at 100 rpm and temperature set at 25°C ± 0.5°C. The experiments were performed three times for each sample and the results are presented as mean ± SD.
2.2.3.6. pH Determination
The pH values of the all microemulsion samples were measured by a pH meter (Digital Systronics, Mumbai, India) at 25°C ± 0.5°C. Which was calibrated at pH 4 and pH 7 standard buffer solutions. All measurements were carried out in triplicate [17].
2.2.3.7. Conductivity Measurement Study
The electric conductivity of ME was measured with a conductivity meter (Equip-Tronics, EQ-664, Mumbai, India) equipped with inbuilt magnetic stirrer. This was performed by using conductivity cell (with a cell constant of 1.0) consisting of two platinum plates separated by desired distance and having liquid between the platinum plate acting as a conductor. All measurements were carried out in triplicate [18].
2.2.3.8. In vitro Drug Release from VCZMEs
The in vitro drug release studies were carried out in the modified USP dissolution apparatus 1 (37°C ± 0.5°C) containing a two-sided open glass cylinder for 12 hours. The diffusion barrier was dialysis membrane, molecular weight cut off 12000-14000A° (Himedia, Mumbai, India) as a release barrier. A pre-soaked dialysis membrane was adapted to the terminal portion of the glass cylinder. In each case, microemulsion (2 ml i.e. VCZ 2mg/ml) was accurately introduced into the glass cylinder from the open side and this cylinder was fixed on the stirrer. The stirrer was suspended in 100 ml dissolution of simulated tear fluid (pH 7.4) medium maintained at 37°C ± 0.5°C at 50 rpm. Aliquots of samples were withdrawn at predetermined time intervals with volume replacement. The withdrawn samples were analyzed for drug content, by measuring absorbance at 255 nm in the double beam UV/Visible spectrophotometer (Lab India, Mumbai, India). Sink conditions were maintained throughout the release period. The same method was used for lyophilized powder (VOZOLE (1% w/v) i.e. 10 mg VCZ reconstituted with 1 ml sterile water for injection) prepared as 2 ml for release study. The comparative release study of drug from VCZMEs and VOZOLE (1% w/v) were carried out. Data obtained in triplicate were analyzed graphically i.e. percent cumulative release versus time graph was plotted [12, 19].
2.2.3.8.1. Drug Release kinetics Modelling
The kinetics of voriconazole release from microemulsions was determined using the release kinetics method of drug release into various kinetic equations: Zero order, First order, Higuchi, Koresmeyer-Peppas, Hixon-Crowell models. The release data was obtained was calculated using various parameters. The drug release mechanism was determined using Korsmeyer-Peppas equation by plotting the graph between log percentages of drug released versus log time.The exponent “n” indicates the mechanism of drug release calculated through the slope of the straight line: Mt/Mf -Ktn
Where Mt is amount of drug release at time t, Mf is amount of drug release at infinite time, K = release rate constant, and n is diffusional exponent indicates the mechanism of drug release.
If value of n falls between 0.5 and 1.0; it is termed as non-Fickian release, while in case of Fickian diffusion, n = 0.5. Forzero order release case II transport n = 1; on the other hand if ‘n > 1’ then it indicates Supercase II transport [20, 21].
2.2.3.9. In vitro transcorneal Permeation Studies
Drug permeation studies were carried out by using modified all glass Franz diffusion cell, putting the voriconazole microemulsion 0.1% w/v i.e. (1 mg/ml) on a freshly excised goat cornea. The fresh, whole eyeballs of goats were obtained from a local butcher's shop and transported to the laboratory chilled in normal saline (4°C). The cornea was then carefully excised along with 2 to 4 mm of surrounding scleral tissue and was washed with normal saline until the washing was free from protein. The excised cornea was fixed between the clamped donor and receptor compartments of an all glass modified Franz diffusion cell in such a way that its epithelial surface faced the donor compartment.The corneal area available for diffusion was 0.75 cm2. The receptor compartment was filled with 10 ml freshly prepared simulated tear fluid (pH 7.4), and all air bubbles were expelled from the compartment. The whole corneal preparation procedure was completed within 1 hour after the sacrifice of goat. The aliquots (1 ml) of the formulated microemulsions were placed on the excised cornea and the opening of the donor cell was sealed with a glass cover slip to prevent evaporation. The acceptor solution was kept at 37°C ± 0.5°Cwith constant stirring using a teflon-coated magnetic stir bead. The permeation study was carried out for 4 hours and samples were withdrawn from the receptor at end of 4 hours. The withdrawn samples were analyzed for drug content by measuring absorbance at 255 nm in a double beam UV/Visible spectrophotometer (Lab India, Mumbai, India). The same method was used for marketed formulation (VOZOLE (1% w/v) i.e. 10 mg VCZ lyophilized powder reconstituted with 1 ml sterile water for injection) prepared as 1ml for permeation study. The comparative release study of drug from selected VCZMEs with VOZOLE (1% w/v) were carried out. Data obtained in triplicate [22, 23].
Permeation (%) = Amount of drug permeated in receptor/Initial amount of drug in donor ×100
2.2.3.9.1. Corneal Hydration Studies
The effect of the voriconazole microemulsions on corneal hydration was determined. In brief, at the end of the experiment, the scleral tissue was removed from cornea; its epithelial surface was wiped with filter paper and weighed (initial weight). The cornea was then soaked in 1ml of methanol, dried overnight at 90°C, and reweighed (final weight). From the difference in weight, corneal hydration (%) was calculated as follows [23]:
Corneal hydration (%) = Initial weight - Final weight / Initial weight ×100
2.2.3.10. In vitro Antifungal Activity
Antifungal activity of formulations was checked by cup-plate method. The medium for antifungal activity was used sabouraud dextrose agar (dextrose 4 gm, mycological peptone 1 gm, agar 1.5 gm). The sabouraud dextrose agar was used in quantity of 6.5 gm and dissolved by heating in100 ml of distilled water with frequent agitation and boiled for 1 min.to dissolve the entire powder and the pH of media maintained at 5.6. Then the prepared media was autoclaved at 121°C for 15 min. The media were poured aseptically into 93 mm diameter glass petri plate and kept till the solidification. The surface of agar plates was pierced using a sterile cork borer. The Candida albicans were inoculated onto agar surface by streaking. An aliquot marketed formulation (VOZOLE (1% w/v)) from 5 µl as a test sample was prepared and placed in first 7 mm wells, An aliquot (IPMVM-11) from 5 µl as a standard sample was prepared the standard sample placed in second 7 mm wells and aliquot Mod.CH (0.25% w/v) solution from 5 µl placed in third 7 mm wells. The plates were left for 30 min and incubated at 25°C ± 1°C for 24 hours. After that zone of inhibitions were measured [24].
2.2.3.11. In vivo Studies
Rabbits were provided by the Central Animal House, Satara College of Pharmacy Satara (SCOPS), Degaon, Satara, MS, India. All experiments were conducted with the permission of Central Animal Ethical Committee, Satara College of Pharmacy Satara (SCOPS), Degaon, Satara, MS, India and were carried out in accordance with the current guidelines for the care of laboratory animals. The animals used for research study, approved by the Local Animal Ethical Committee of Shivaji University (Approval No. 2011/158).
In vivo studies were carried out on healthy rabbit eyes which inflamed with fungal keratitis. In vivo study performed for determination of VCZ concentrations in the aqueous humor were carried out on rabbit eyes; evaluation of therapy and measurement of ocular irritancy were conducted on fungal keratitis induced rabbits. For study five months old male albino white rabbits weighing 3–3.5 kg were used. Rabbits were housed in a air-conditioned room maintained at temperature (22°C ± 1°C) with an alternating 12 hour light–dark cycle and fed a standard pellet diet and water ad libitum. Rabbits were provided with artificial fluorescent light. These conditions were checked, on a daily basis, to ensure animal safety and well-being.
IPMVM-11 was selected for the in vivo study on the basis of droplet size, viscosity and better ex vivo study through goat cornea. The rabbits were divided into three groups of three rabbits each (six eyes). The rabbits in groups 1 and 2 were topically instilled with IPMVM-11 (in right eye) and marketed formulation (VOZOLE (1% w/v)) (in left eye) respectively, while group 3 (control group) received sterile physiological saline solution. Using a calibrated dropper, 50 µl of IPMVM-11 was instilled twice daily for group 1, whereas group 2 was treated with 50 µl of the VOZOLE (1% w/v) four times a day for three days before the generation of fungal keratitis and continued for three days after induction. After 24 hours the induction of fungal keratitis, the aqueous humor sampling was performed for determination of VCZ content within aqueous humor.
2.2.3.11.1. Determination of VCZ Concentration in the Aqueous Humor
Prior intrastromal injection all rabbits were systemically anaesthetized with intramuscular injections of ketamine hydrochloride (50 mg/kg) in combination with a relaxing agent xylazine (10 mg/kg) [25]. They were locally anaesthetized with benoxinate HCl (0.4% w/v, 2 drops) applied to the rabbit eyes at post instillation, aqueous humor samples (0.15 ml ≈ 50–80 µl) were withdrawn at 1, 4, 8 and 12 hours by anterior chamber paracentesis using an insulin syringe (1.0 ml) fitted with a 29 gauge needle. The samples were collected and stored at −20°C until analyzed. The needle was introduced into the anterior chamber through the cornea, taking care not to damage the iris and the lens. The aqueous humor samples were instantly placed in eppendorf tubes [26]. The aqueous humor samples were filtered through a 0.45 µm membrane filter before determination of VCZ content using a validated HPLC method, as previously described. Data obtained in triplicate were analyzed graphically i.e. aqueous humor concentration versus time graph was plotted. The pharmacokinetic parameters, as the peak aqueous humor concentration (Cmax) and the areas under the concentration–time curve (AUC0→t) were calculated based on the concentration of VCZ in the aqueous humor over the 12 hours.
2.2.3.11.2. Induction of Fungal Keratitis and Topical Therapy
Candida albicans the most frequent fungal species responsible for formation of fungal keratitis was cultured on sabouraud dextrose agar which incubated at 25°C for 24 hours.Fungal suspension was adjusted to 0.5 McFarland turbidity (108 CFU/ml) with sterile physiological saline solution. Candida albicans suspension was diluted to 5000 CFU/ml to constitute corneal infection. In order to induce fungal keratitis, all rabbit groups were infected with Candida albicans. The central portion of the cornea of each rabbit was intrastromally infected with 0.1 ml fungal suspension using a sterile 29 gauge needle. After 18 hours of inoculation, fungal keratitis was confirmed and then topical therapy was started with the selected optimum formulation (IPMVM-11) and marketed formulation (VOZOLE (1% w/v)). In groups infected with Candida albicans, left eyes of rabbits were treated with VOZOLE (1% w/v), whereasIPMVM-11 were applied to the right eyes. An infected control group was treated only with sterile physiological saline solution. Treatment consisted of two drops (1 drop ≈ 50 µl) at every 12 hour and 24 hour, during 7 days (total 14 doses). The eyes of rabbits were examined for clinical signs of fungal keratitis (corneal abscess/ulcer with excessive vascularisation, gray-brown pigmentation, hypopyon and endothelial plaque) every day of therapy.
2.2.3.11.3. Clinical Grading of Ocular Inflammation
The ocular effectiveness of prepared IPMVM-11 and VOZOLE (1% w/v) was evaluated by modified draize test [27]. After end of the treatment the acceptability of IPMVM-11, VOZOLE (1% w/v) and sterile physiological saline solution were tested by the Draize test using the rabbit model for determination conjunctival redness were graded on a scale from 0 to 3. The grading scale was as follows: 0; Blood vessels normal, 1; some blood vessels hyperaemic, 2; diffuse color, individual vessels not easily discernible, 3; diffuse beefy red. The total added score index more than 5 are considered as non-acceptable and ineffectiveness. The grading of clinical signs of fungal keratitis was performed at 0, 24, 72 and 168 hours after intravitreal injection of endotoxin.
2.2.3.12. Data Analysis
All values existing in the study are average of triplicate experiments for the same time points. Ex vivo permeation and in vivo profile of voriconazole microemulsions were tested statistically using one-way analysis of variance (ANOVA) followed by Dunnett’s test using graph pad prism 5 software (graph pad software inc., San Diego CA) at different level of significance. (†Statistically significant difference at p < 0.05; ††statistically significant difference at p < 0.01; †††statistically significant). The results were expressed as mean values ± SD.
3. RESULTS AND DISCUSSION
Microemulsion have a narrow droplet size distribution, a large capacity to solubilize drugs are inexpensive and unlike emulsions transparent, thermodynamically stable, monophasic, form spontaneously no energy requirement, low viscosity with Newtonian behaviour etc. [28]. The 5% w/w oil with as per possible lowest Smix concentration used in the formulations which selected on the basis of pseudo-ternary phase diagrams to maintained viscosity and pseudo plastic behaviour of the ME system concerned for ophthalmic purpose.
3.1. Screening of Excipients (Selection of Oils, Surfactant and Co-surfactant)
3.1.1. Solubility Studies
3.1.1.1. Solubility Determination of Voriconazole in Different Oils
The solubility study indicates the drug loading capability. Oils can solubilize the lipophilic drug in specific amount. To develop topical VCZMEs for ocular application, the solubility determined in different oils, surfactants, co-surfactants [13, 15]. On the basis of solubility study of voriconazole in various oils like oleic acid (35.74 ± 2.22mg/ml), isopropyl myristate (13.83 ± 1.19mg/ml), isopropyl palmitate (13.05 ± 1.23mg/ml), olive oil (12.65 ± 1.07 mg/ml), cotton seed oil (11.88 ± 1.03 mg/ml), soya oil (10.38 ± 1.08 mg/ml), castor oil (6.27 ± 2.91 mg/ml), liquid paraffin (3.11 ± 0.54 mg/ml).
3.1.1.2. Solubility Determination of Voriconazole in Different Surfactants/Co-surfactants
There are several components exhibiting surfactant properties may be employed for microemulsion systems, but the choice is limited as very few surfactants are applicable for eye. Generally non-ionic surfactants are preferred. VCZ solubility in various surfactants/co-surfactants like tween 80 (25.14 ± 1.06mg/ml), propylene glycol (34.63 ± 2.13mg/ml), PEG 200 (31.58 ± 2.03 mg/ml), PEG 400 (26.73 ± 2.22 mg/ml), plurololeique (3.41 ± 0.25 mg/ml), span 80 (1.77 ± 0.21 mg/ml). The HLB value of tween 80 and propylene glycol is 15 and 11.6 respectively. As per concern o/w microemulsion usually high HLB surfactant match with low HLB co-surfactant [29]. Since the non-ionic surfactant and co-surfactant do not ionise at any extent in solution, so that tween 80 and propylene glycol were selected as an ideal surfactant and co-surfactant for the system [30].
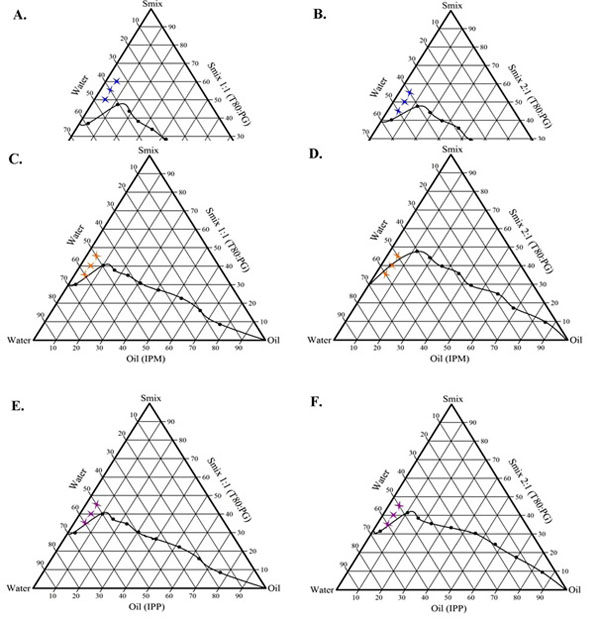 |
Fig. (1). Phase diagrams of (A) O/W microemulsion region of OA, Smix 1:1 and water. (B) O/W microemulsion region of OA, Smix 2:1 and water. (C) O/W microemulsion region of IPM, Smix 1:1 and water. (D) O/W microemulsion region of IPM, Smix 2:1 and water. (E) O/W microemulsion region of IPP, Smix1:1 and water. (F) O/W microemulsion region of IPP, Smix 2:1 and water. |
3.2. Construction of Pseudo-ternary Phase Diagram (Phase Behavior)
The aim of construction of pseudo-ternary phase diagrams was to find out the existence region of oil in water microemulsions using water titration method. Phase diagrams also helpful for selection of concentration range of components for the formation of clear and stable microemulsion system. The selected components are used for to construct phase diagram which includes oleic acid, isopropyl myristate, isopropyl palmitate, tween 80, propylene glycol and water. For each phase diagram, oil and specific Smix ratio was mixed thoroughly in different volume ratios from 1:9 to 9:1 in different glass test tubes. Nine different combinations of oil and Smix, 1:9, 2:8, 3:7, 4:6, 5:5, 6:4, 7:3, 8:2 and 9:1 were made for the study to delineate the boundaries of phases precisely formed in the phase diagrams. The region for o/w microemulsion represented in phase diagram. Among all Smix (tween 80: propylene glycol) ratios studied such as 1:1, 2:1, 3:1, 4:1. The mixture of oil as to Smix was titrated with distilled water until it turned turbid. Each point examined carefully.In that the ratio of 1:1 and 2:1 formed better microemulsion region and more water incorporation. The phase study revealed that the maximum proportion of water incorporated in presence of Smix was 1:1 and 2:1 and as per possible lowest surfactant system can be achieved to form visually clear microemulsion compared to 3:1 and 4:1 ratio forms. No distinct conversion of oil in water to water in oil was observed. Hence the optimum ratio of Smix selected as 1:1 and 2:1 used in this study [13]. As increased the tween 80 concentration in ratio 1:1 to 2:1, microemulsion region was also slightly increased. The phase diagrams of different microemulsions are shown in Fig. (1).
3.3. Characterization of Voriconazole Microemulsions
The three different formulations of MEs such as voriconazole microemulsion with oleic acid (OAVM), voriconazole microemulsion with isopropyl myristate (IPMVM) and voriconazole microemulsion with isopropyl palmitate (IPPVM) are characterized for different physicochemical properties such as droplet size, zeta potential, polydispersity index, drug content, viscosity, pH and conductivity represented in Table 2 and the selected microemulsion formulations was further characterized for in vitro, ex vivo and in vivo studies.
|
Solvents (oil/surfactant/co-surfactant) |
Solubility (mg/ml) |
|---|---|
| Oleic acid | 35.74 ± 2.22 |
| Isopropyl myristate | 13.83 ± 1.19 |
| Isopropyl palmitate | 13.05 ± 1.23 |
| Olive oil | 12.65 ± 1.07 |
| Cotton seed oil | 11.88 ± 1.03 |
| Soya oil | 10.38 ± 1.08 |
| Castor oil | 6.27 ± 2.91 |
| Liquid paraffin | 3.11 ± 0.54 |
| Tween 80 | 25.14 ± 1.06 |
| Propylene glycol | 34.63 ± 2.13 |
| PEG 200 | 31.58 ± 2.03 |
| PEG 400 | 26.73 ± 2.22 |
| Plurololeique | 3.41 ± 0.25 |
3.3.1. Thermodynamic Stability/Dispersibility Studies
The microemulsions are thermodynamically stable system formed at specific concentrations of oil, Smix and water among no phase separation, creaming, cracking. MEs are differentiates from emulsion having kinetic stability and immediately separates the phase. To overcome the problems with metastable formulations, thermodynamic stability tests were performed which includes heating/cooling cycle, centrifugation, freeze thaw cycle and further subjected to dispersibility test [14, 15]. The results of thermodynamic stability study and dispersibility tests are shown in Table 3 (reported data given in Supplementary Files, Table S1).
| Batch code | Droplet size (nm) |
Zeta potential (mV) |
PDI | Drug content (%) | Viscosity (cP) | pH | Conductivity (µS) |
|---|---|---|---|---|---|---|---|
| *OAVM-1 | 231.0 ± 3.42 | 13.2 ± 1.61 | 0.298 ± 0.04 | 93.22 ± 1.25 | 10.73 ± 0.49 | 6.69 ± 0.12 | 121.2 ± 1.20 |
| *OAVM-2 | 185.1 ± 2.23 | 16.7 ± 1.12 | 0.359 ± 0.05 | 89.86 ± 1.35 | 13.11 ± 0.46 | 6.16 ± 0.14 | 118.1 ± 2.16 |
| *OAVM-3 | 160.1 ± 3.09 | 15.3 ± 1.23 | 0.404 ± 0.02 | 91.93 ± 2.29 | 16.17 ± 0.43 | 5.89 ± 0.30 | 116.2 ± 1.35 |
| *OAVM-4 | 245.2 ± 2.90 | 12.8 ± 2.13 | 0.378 ± 0.01 | 94.25 ± 2.07 | 13.85 ± 0.25 | 6.72 ± 0.13 | 122.2 ± 1.25 |
| *OAVM-5 | 208.2 ± 2.95 | 14.2 ± 1.88 | 0.415 ± 0.01 | 92.96 ± 1.65 | 15.80 ± 0.26 | 6.58 ± 0.20 | 120.3 ± 1.34 |
| *OAVM-6 | 165.2 ± 2.03 | 13.1 ± 2.09 | 0.461 ± 0.01 | 91.15 ± 1.49 | 18.04 ± 0.53 | 6.29 ± 0.11 | 118.8 ± 2.08 |
| *IPMVM-7 | 224.4 ± 2.83 | 10.7 ± 1.80 | 0.366 ± 0.02 | 94.64 ± 3.82 | 9.86 ± 0.41 | 6.67 ± 0.08 | 112.1 ± 1.56 |
| *IPMVM-8 | 194.3 ± 2.90 | 13.7 ± 1.87 | 0.402 ± 0.03 | 90.12 ± 1.62 | 12.10 ± 0.28 | 6.05 ± 0.10 | 113.1 ± 2.01 |
| *IPMVM-9 | 161.9 ± 1.85 | 11.4 ± 1.59 | 0.453 ± 0.02 | 93.48 ± 2.60 | 16.12 ± 0.63 | 5.89 ± 0.11 | 115.2 ± 1.36 |
| *IPMVM-10 | 203.2 ± 2.78 | 11.7 ± 2.09 | 0.407 ± 0.03 | 92.83 ± 3.91 | 9.53 ± 0.18 | 6.71 ± 0.05 | 105.1 ± 1.53 |
| *IPMVM-11 | 178.9 ± 1.52 | 15.4 ± 1.60 | 0.383 ± 0.02 | 92.44 ± 1.95 | 12.78 ± 0.28 | 6.20 ± 0.18 | 106.7 ± 2.57 |
| *IPMVM-12 | 158.1 ± 2.13 | 13.9 ± 2.34 | 0.402 ± 0.05 | 90.37 ± 2.40 | 16.14 ± 0.50 | 5.74 ± 0.10 | 109.9 ± 1.99 |
| *IPPVM-13 | 241.4 ± 3.24 | 10.4 ± 1.08 | 0.339 ± 0.02 | 93.22 ± 1.78 | 10.47 ± 0.26 | 6.42 ± 0.03 | 110.9 ± 1.42 |
| *IPPVM-14 | 195.1 ± 1.96 | 12.0 ± 1.38 | 0.409 ± 0.05 | 90.76 ± 2.89 | 11.21 ± 0.15 | 6.07 ± 0.16 | 112.2 ± 2.29 |
| *IPPVM-15 | 152.3 ± 3.06 | 11.1 ± 1.21 | 0.435 ± 0.03 | 91.41 ± 1.91 | 15.43 ± 0.22 | 5.78 ± 0.13 | 114.8 ± 1.32 |
| *IPPVM-16 | 222.2 ± 1.83 | 12.7 ± 1.56 | 0.441 ± 0.03 | 91.93 ± 2.29 | 11.92 ± 0.38 | 6.75 ± 0.07 | 105.1 ± 1.55 |
| *IPPVM-17 | 185.9 ± 1.21 | 14.8 ± 1.18 | 0.427 ± 0.04 | 93.35 ± 2.88 | 13.68 ± 0.14 | 6.26 ± 0.12 | 106.9 ± 2.43 |
| *IPPVM-18 | 156.6 ± 2.09 | 13.3 ± 1.19 | 0.361 ± 0.02 | 90.63 ± 2.92 | 16.37 ± 0.19 | 6.07 ± 0.19 | 109.6 ± 2.26 |
3.3.2. Drug Content (%) Assay
The drug content of ME, OAVM-1 to OAVM-6 was found to be in the range of 89.86 ± 1.35% to 94.25 ± 2.07%, IPMVM-7 to IPMVM-12 was found to be in the range of 90.12 ± 1.62% to 94.64 ± 3.82% and IPPVM-13 to IPPVM-18 was found to be in the range of 90.63 ± 2.92% to 93.35 ± 2.88%. The drug content of different microemulsion formulations are given in Table 2. This indicates irrespective distribution of drug in different compositions of MEs.
3.3.3. Infrared Spectroscopy (FTIR) Analysis of ME Formulations
The FTIR analysis was conducted to authenticate possibility of interaction of chemical bonds between drug and excipients present in the formulation. Fig. (2) showed stacked IR spectra of pure drug, polymer, physical mixture (drug with polymer), each three oils, surfactant/co-surfactant and OAVM-2, IPMVM-11 and IPPVM-17. The Pure VCZ FTIR spectrum showed O-H stretching at 3600-3200 cm−1, C-N aryl stretching at 1360-1250cm−1 and C-F stretching at 1587.44–1451.28 cm−1, C-H alkane at 3000-2800 cm−1, C=C aromatic at 1600-1400 cm−1. The Mod.CH showed absorption band at primary amine (R-NH2) at 1640-1550 cm−1, secondary amine (R2-NH) at 3329.14 cm−1, ether at 1150-1066 cm−1, alcoholic group O-H at 3600-3200 cm−1 and CH3 at 3000-2800 cm−1. Physical mixture showed characteristics peak of drug such as O-H at 3529.73 cm−1, C-H (alkane) stretching at 1296.16 cm−1, C=O stretching at 1735 cm−1, C=C (alkenes) stretching at 1641.42 cm−1.The physical mixture of voriconazole and Mod.CH showed no major shifting of any functional peaks. Hence, it was indicated that there was no interaction between the drug and polymer used.Pure OA showed two sharp band such as CH2 stretching (asym.) at 2922.16, CH2 stretching (sym.) at 2852.72 cm−1, C=O stretching at 1708.93 cm−1, C-O stretching at 1282.66 cm−1, O-H at 1460.11 cm−1 and 935.48 cm−1.Pure IPMshowed CH2 stretching (asym.) at 2922.16 cm−1, CH2 stretching (sym.) at 2852.72 cm−1, C=O stretching at 1734.01 cm−1, C-O stretching at 1247.94 cm−1, C-O-H in plane band at 1465.90 cm−1. Pure IPP showedCH2 stretching (asym.) at 2922.16 cm−1, CH2 stretching (sym.) at 2852.72 cm−1, C=O stretching at 1734.01 cm−1, C-O stretching at 1251.80 cm−1, C-O-H in plane band at 1465.90 cm−1. The spectrum of tween 80 showed O-H absorption band at 3485.37-3529.73 cm−1, C-H (alkane) stretching at 1296.16 cm−1, C-O stretching at 1735.0 cm−1, C=C (alkene) stretching at 723.31-881.81 cm−1. The spectrum of propylene glycol showed O-H stretching at 3323.35-3338.78 cm−1, C-H stretching at 2970.38 cm−1, C=C stretching at 1653 cm−1, C-O stretching at 1039.63 cm−1.The characteristic peak of OAVM-2 such as O-H stretching at 3217.27 cm−1, C-N stretching at 1244.09 cm−1, C-F stretching at 1444.68 cm−1, C-H alkane at 2922.16 cm−1. The characteristic peak of IPMVM-11 such as O-H stretching at 3373.50 cm−1, C-N aryl stretching at 1350.17 cm−1, C-H alkane at 2980.02 cm−1, The characteristic peak of IPPVM-17 such as O-H stretching at 3365.78 cm−1, C-N aryl stretching at 1286.52 cm−1, C-F stretching at 1452.40 cm−1, C-H alkane at 2979.14 cm−1. The FTIR study concluded that all three VCZMEs of the each oil with drug, polymer, surfactant/co-surfactant exhibited the characteristic bands which confirm that there is no interaction between voriconazole, Mod.CH (0.25% w/v), each oil and surfactant/co-surfactant.
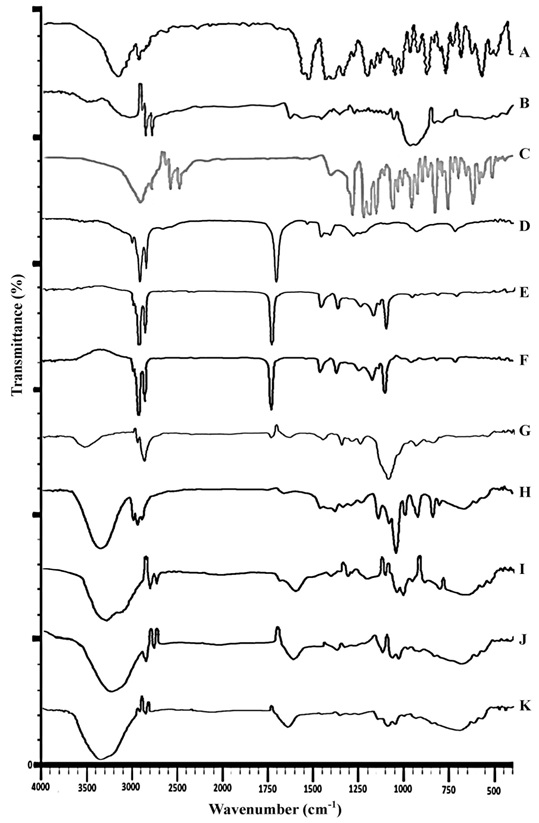 |
Fig. (2). FTIR Spectra of (A)Voriconazole;(B) Modified chitosan;(C) Physical mixture (voriconazole with modified chitosan);(D) Oleic acid;(E) Isopropyl myristate;(F) Isopropyl palmitate;(G) Tween 80;(H) Propylene glycol;(I) OAVM-2;(J) IPMVM-11;(K) IPPVM-17. |
3.3.4. Droplet Size, Zeta Potential and Polydispersity Index Measurements
3.3.4.1. Droplet Size
The results of droplet size of freshly prepared VCZME formulations are characterized which are formulated with water titration method. All ME formulations showed a mean droplet size below 250 nm which is an optimum size for ophthalmic delivery as the human eye can tolerate particles smaller than 10 µm [31]. However, according to Hoar and Schulman the droplet size range of MEs in between 5-200 nm [32].The droplet size of formulations i.e. OAVM-1 to OAVM-6 ranges from 160.1 ± 3.09 nm to 245.2 ± 2.90 nm, IPMVM-7 to IPMVM-12 ranges from 158.1 ± 2.13 nm to 203.2 ± 2.78 nm and IPPVM-13 to IPPVM-18 ranges from 152.3 ± 3.06 nm to 241.4 ± 3.24 nm (Table 2). At an optimum polymer concentration of Mod.CH (0.25% w/v) with increasing the concentration of surfactant the droplet size of each selected formulations was decreased. The droplet size of MEs reduces as increased tween 80 concentrations. These results also have support to previous published mucoadhesive chitosan-coated cationic dexamethasone microemulsion [12].
3.3.4.2. Zeta Potential
Zeta potential is an important parameter for surface characterization technique which helps in determining the potential stability and surface charge of nanodroplet system. Normally absolute large negative or positive zeta potential value is required for colloidal dispersion stability as electrostatic repulsion between particles with similar charges avoid aggregation [33]. All formulations of exhibited positive zeta potential values VCZMEs, which were OAVM-1 to OAVM-6 varies from 12.8 ± 2.13 mV to 16.7 ± 1.12 mV, IPMVM-7 to IPMVM-12varies from 10.7 ± 1.8 mV to 15.4 ± 1.60 mV, IPPVM-13 to IPPVM-18varies from 10.4 ± 1.08 mV to 14.8 ± 1.18 mV (Table 2).The positive surface potential value of VCZMEs due to presence of cationic agent such as Mod.CH (0.25% w/v) at oil/water interface moreover surfactant/co-surfactant (tween 80/propylene glycol) is non-ionic in nature.
3.3.4.3. Polydispersity Index
The polydispersity index (PDI) is a marker of particle size distribution. It also indicates the stabilization of formulation. Its value ranges from 0.01 to 0.5 indicates narrow size distribution, while PDI above 0.7 indicates very broad size distribution [34].The polydispersity index of all MEs, OAVM-1 to OAVM-6 varies from 0.298 ± 0.04 to 0.461 ± 0.01, IPMVM-7 to IPMVM-12varies from 0.366 ± 0.02 to 0.453 ± 0.02, IPPVM-13 to IPPVM-18varies from 0.339 ± 0.02 to 0.441 ± 0.03 (Table 2). This indicates narrow size distribution with higher stability of MEs.
3.3.5. Viscosity Measurement Study
The viscosity of ophthalmic formulation is an important parameter. In case the low viscosity causes immediate drainage from eye and responsible for limited ocular bioavailability.Moreover, higher viscosity causes blurred vision and little blinking pain. The viscosity of the MEs increased along with increase in the amount of Smix [35]. At an optimum concentration of Mod.CH (0.25% w/v) produces optimum viscosity of MEs at 100 rpm in the formulations, OAVM-1 to OAVM-6 varied from 11.06 ± 0.48 cP to 18.04 ± 0.53 cP, IPMVM-7 to IPMVM-12varied from 9.53 ± 0.18 cP to 16.14 ± 0.50 cP, IPPVM-13 to IPPVM-18varied from 10.47 ± 0.26 cP to 16.37 ± 0.19 cP (Table 2). The viscosity in between 8-16 cP covers the efficient criteria for eye drop. At lower shear rate viscosity increases and at higher shear rate viscosity decreases [36].The selected VCZMEs exhibited non–Newtonian flow (shear thinning) (see Fig. 3A). During blinking the shear rates are very high and these shear thinning fluids exhibit low viscosity. The tear drainage occurs due to low viscosity of formulation while a high viscosity formulation reduces ocular drainage and induces precorneal residence time [37].
 |
Fig. (3). (A) Effect of shear rate on viscosity; (B) Dilution effect of water on conductivity. |
3.3.6. pH Determination
When the formulation instilled to eye, it stimulates tears flow and the tear fluids capable of rapidly diluting and buffering small volumes of added substances thus eye can tolerates wide pH range. The therapeutic substances for eye drops must be isotonic and isohydric and their pH can vary from 3.5 to 8.5 but the useful range to prevent corneal damage is 6.5 to 8.5 [38]. The values of prepared VCZMEs like OAVM-1 to OAVM-6 varied from 5.89 ± 0.30 to 6.72 ± 0.13, IPMVM-7 to IPMVM-12varied from 5.74 ± 0.10 to 6.71 ± 0.05, IPPVM-13 to IPPVM-18 varied from 5.78 ± 0.13 to 6.75 ± 0.07 (Table 2). Hence it has been assumed that after instillation of formulation in eye should influence the normal behaviour of tear as small as possible.
3.3.7. Conductivity Measurement Study
The electrical conductivity of particular solution depends upon the concentration of ions and ion migration rate. The electrical conductivity of system increases linearly as increasing concentration of water i.e. system acts as insulator to conductor. The conductance value of MEs, OAVM-1 to OAVM-6 varied from 116.2 ± 1.35 µS to 122.2 ± 1.25 µS, IPMVM-7 to IPMVM-12varied from 105.1 ± 1.53 µS to 115.2 ± 1.36 µS and IPPVM-13 to IPPVM-18varied from 105.1 ± 1.55 µS to 114.8 ± 1.32 µS (Table 2). These higher conductivity values due to presence of more water concentration in formulation represent o/w microemulsions also the lower conductivity value represent w/o microemulsions. As increase in water concentration conductance of microemulsion system also increases reason for that increase in water concentration number of conductive ions per unit volume dissociates then the size of droplets also increases which is beneficial for fusion of water droplets via collision and therefore increase the migration rate of water droplet; which is more [39]. The bell shaped curve and at particular point conductance value declined (see Fig. (3B) that might be due to increased viscosity of formulation leads to clustering of nanodroplets. i.e. decreased concentration of discrete droplets [40].
3.3.8. In vitro Drug Release from VCZMEs
In vitro drug release studies of all formulations were carried out in simulated tear fluid (pH 7.4) by using dialysis membrane. The release profile of voriconazole from all microemulsions (see Fig. 4) and results demonstrated that all formulation caused a sustained drug release up to 12 hours. The drug loaded in microemulsions hinders the drug release i.e. initial burst release in half hour of MEs (OAVM> 22%), (IPMVM > 21%), (IPPVM> 15%) followed by slow release in 12 hours more than 82% of all MEs, which suggest that oil phase served as depot for drug release, while the drug transport occurred primarily due to water phase [41]. This might be due to fact that smaller droplet size with more surface area, which increases the diffusional path length [42]. The Mod.CH present in between interface of oil and water responsible for sustained release of drug from microemulsion. At an optimum concentration of Mod.CH (0.25% w/v) with increase in surfactant/co-surfactant concentration, viscosity of the system also increases this may suggested increases the precorneal residence time for longer period and provides sustained drug release. The result also revealed that, chitosan provides better viscosity results sustained drug release. The results suggested that VCZME formulations shown sustained release in following order (OAVMs > IPMVMs > IPPVMs). It might due to comparatively higher drug loading of IPMVM and OAVM than IPPVM. The comparative release from VOZOLE (1% w/v) released 93.63 ± 1.54% voriconazole within 3 hours shown in Fig. (4). It suggests that, due to less viscosity of marketed formulation not able to sustain the release as compared to optimum formulation of microemulsion. Dialysis membrane filter acts as a mechanical barrier to drug diffusion.
3.3.8.1. Drug Release Kinetics Modelling
The release data obtained was fitted into various kinetic models like Zero order, First order, Higuchi, Koresmeyer-Peppas and Hixon-Crowell models. In order to determine the release mechanism and regression coefficients (R2) [43]. The release of voriconazole from microemulsion fitted best in Higuchi-square-root release kinetics, which can be confirmed by comparing values for the regression coefficients of Zero order, First order, Higuchi, Koresmeyer-Peppas and Hixon-Crowell models summarized in Table 4 (reported data given in Supplementary Files, Table S1). The value of ‘n’ (0.45< n <0.89) the diffusion exponent of Koresmeyer-Peppas equation confirmed that release of voriconazole from microemulsion is anomalous, i.e. contributed by combination of dissolution and diffusion.
| Batch code | Zero order | First order | Higuchi | Koresmeyer-Peppas | Hixon-Crowell | ||||||
|---|---|---|---|---|---|---|---|---|---|---|---|
| Dt = D0 + k0 t | ln Dt = ln D0 + k1 t | Dt = D0 + kH t1/2 | Dt/D∞ = KKP tn | Dt1/3 = D0 1/3 - KHC t | |||||||
| R2 | K0 | R2 | K1 | R2 | KH | R2 | n* | KKP | R2 | KHC | |
| OAVM-2 | 0.9384 | 0.1045 | 0.9680 | -0.0012 | 0.9937 | 3.2447 | 0.9892 | 0.4898 | 0.5257 | 0.9908 | -0.0027 |
| IPMVM-8 | 0.9601 | 0.1070 | 0.9111 | -0.0013 | 0.9710 | 3.3987 | 0.9588 | 0.5124 | 0.4288 | 0.9546 | -0.0024 |
| IPMVM-11 | 0.9417 | 0.1036 | 0.9364 | -0.00011 | 0.9749 | 3.1935 | 0.9660 | 0.4693 | 0.3870 | 0.9711 | -0.0026 |
| IPPVM-14 | 0.9640 | 0.0991 | 0.9623 | -0.0015 | 0.9876 | 3.2148 | 0.9862 | 0.5604 | 0.2854 | 0.9843 | -0.0026 |
| IPPVM-15 | 0.9438 | 0.0971 | 0.9360 | -0.0014 | 0.9819 | 3.3981 | 0.9588 | 0.5189 | 0.4329 | 0.9710 | -0.0027 |
| IPPVM-17 | 0.9280 | 0.0947 | 0.9508 | -0.0008 | 0.9841 | 2.8742 | 0.9801 | 0.4833 | 0.5074 | 0.9773 | -0.0025 |
Dt is the amount of drug released at time t, D0 is the initial amount of drug released, Dt/D∞ is fraction of drug released at time t, k0 is the zero order release constant, k1 is the first order release constant, kH is the Higuchi release constant, kHC is the Hixson-Crowell rate constant, KKP is the Koresmeyer-Peppas release constant, R2 is the regression coefficient values of drug release data calculated from various drug release kinetic models, n* is the diffusional exponent.
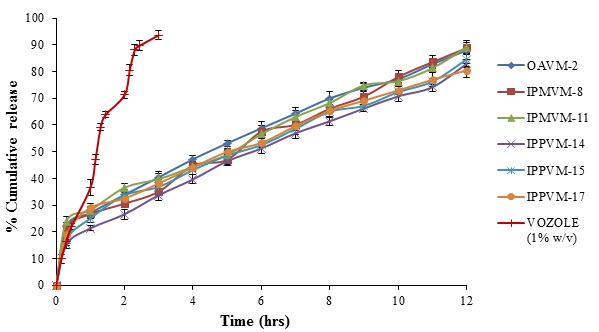 |
Fig. (4). In vitro release profile of selected voriconazole microemulsions and marketed formulation (VOZOLE (1% w/v)) through dialysis membrane. |
3.3.9. In vitro Transcorneal Permeation Studies
Table 5 showed comparative in vitro transcorneal permeation profile of the ME formulations. The optimized batches (OAVM-2, IPMVM-11 and IPPVM-17) selected on the basis according to droplet size, polydispersity index, zeta potential and viscosity values were selected for corneal permeation studies. The maximum drug permeation was obtained from IPMVM-11 (6.907 ± 0.067%)(p<0.01)followed by OAVM-2 (5.240 ± 0.081%) and IPPVM-17(4.731 ± 0.064%)at the end of 4 hours. The results suggested that VCZME formulations shows drug permeation in following order (IPMVM-11 > OAVM-2 > IPPVM-17).The result might be contribute that the formulation (IPMVM-11) contains isopropyl myristate which helps to higher permeation due to penetration effect of isopropyl myristate as compared to oleic acid and isopropyl palmitate (OAVM-2 and IPPVM-17). The permeation study of VOZOLE (1% w/v) provide 2.075 ± 0.046% drug release within 4 hours. Since it was suggested that VOZOLE (1% w/v) unable to penetrate the drug adequately than selected VCZMEs (OAVM-2, IPMVM-11, IPPVM-17) shown better permeation. The addition of Mod.CH (0.25% w/v) in formulations sufficiently increases the penetration of voriconazole. The chitosan is positive charged molecule having mucoadhesive property and releases drug slowly in sustained manner due to formation of positive-negative complex over the cornea. Also, the chitosan showed different properties like biodegradability, non-toxicity, biocompatibility, mucoadhesiveness and acts as coating material as per the literature [9]. The in vitro transcorneal drug permeation studies of voriconazole microemulsion and VOZOLE (1% w/v) through excised goat corneas were listed in Table 3. To mimic the real life conditions, excised goat corneas were used for permeation studies and the experiment was conducted for 4 hours considering corneal viability.
| Formulations |
Amount of drug permeated in 4 hrs |
Permeation (%) | Corneal hydration level (%) | |
|---|---|---|---|---|
| (µg) | (mg) | |||
| VOZOLE (1% w/v) | 20.747 ± 0.458 | 0.021 ± 0.001 | 2.075 ± 0.046 | 76.433 ± 0.188 |
| OAVM-2 | 52.399 ± 0.813† | 0.052 ± 0.001 | 5.240 ± 0.081 | 79.270 ± 0.256 |
| IPMVM-11 | 69.073 ± 0.667†† | 0.069 ± 0.001 | 6.907 ± 0.067 | 77.780 ± 0.699 |
| IPPVM-17 | 47.310 ± 0.637† | 0.047 ±0.001 | 4.731 ± 0.064 | 77.213 ± 0.213 |
3.3.9.1. Corneal Hydration Studies
The corneal hydration level of normal mammalian cornea is between 75% and 80%. A variation in these levels shows damage to the endothelium or epithelium [23]. The selected microemulsions with optimum concentration of Mod.CH (0.25% w/v) did not show any corneal damage i.e.. they did not show any destruction to cornea. The corneal hydration value of the selected formulations (OAVM-2, IPMVM-11, IPPVM-17) and VOZOLE (1% w/v) was between 75 to 80%, which indicated that the formulations did not cause any harm to the corneal tissue. The corneal hydration level of selected VCZMEs with VOZOLE (1% w/v) reported in Table 5.
3.3.10. In vitro Antifungal Activity
The microbiological assay studies were conducted using agar diffusion method. The results indicate that the voriconazole loaded microemulsion (IPMVM-11) with Mod.CH significantly inhibits the growth of Candida albicans as compared to VOZOLE (1% w/v). The mean diameter of zone of inhibition against Candida albicans, VOZOLE (1% w/v) was 14.33 ± 1.20 mm, Mod.CH (0.25% w/v) was 5.33 ± 0.88 mm and IPMVM-11 was 23.33 ± 1.45 mm (Fig. 5).
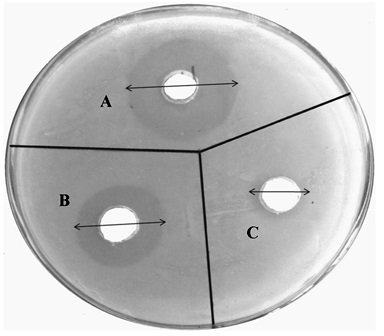 |
Fig. (5). Microbiological studies using (A)Voriconazole microemulsion (IPMVM-11); (B)VOZOLE (1% w/v); (C)Modified chitosan (0.25% w/v) solution against Candida albicans by agar diffusion method after 24 hours. |
3.3.11. In vivo Studies
3.3.11.1. Determination of VCZ Concentration in the Aqueous Humor
Currently used ocular drugs towards eye are associated with a number of problems complicated by the unique physiology of the eye i.e. toughest corneal barrier. Since precorneal loss of drug associated with poor bioavailability. To maintain drug in aqueous humor to enhance bioavailability of drug, this is sign of successful therapy. So it is necessary to determine the drug concentration in aqueous humor especially in case fungal keratitis which fulfils the aim of in vivo studies. VCZ concentration in aqueous humor shown in Fig. (6). Marketed formulation (VOZOLE (1% w/v)) showed the highest VCZ concentration in aqueous humor for 1 hour. However, no sustainable drug concentration obtained with VOZOLE (1% w/v). The concentration peak (Cmax) of VCZ in aqueous humor was higher and sustained of 14.05 ± 0.57 µg/ml was reached at 240 min. (tmax= 4 hours) with IPMVM-11 whereas the concentration of 4.31 ± 0.58 µg/ml was reached at 60 min. (tmax= 1 hours) i.e. lowest achieved with VOZOLE (1% w/v). The sustained release of VCZ was seen to reach that peak state (tmax= 4 hours) acted as a facts for attain sustained release effect. The AUC0→t, calculated for IPMVM-11 and VOZOLE (1% w/v) which was 28.25 µg h/ml and 4.13 µg h/ml respectively, i.e. the AUC0→t of IPMVM-11was around 6.84-fold(p<0.01) higher than VOZOLE (1% w/v). Moreover the bioavailability of IPMVM-11 enhanced as comparatively VOZOLE (1% w/v). The possibility of drug delivery from VOZOLE (1% w/v) was lowest and the drug delivery from IPMVM-11 was as long as achieved in aqueous humor. This result suggested to longer residence time of IPMVM-11 in eye responsible for higher concentration of drug in aqueous humor.
Di Colo has shown that still in a solution form of water soluble chitosan (chitosan hydrochloride) could enhance the transcorneal penetration of ofloxacin [44]. In our present study contribution with loading of VCZ in oil phase and water soluble Mod.CH (0.25% w/v) at oil/water interphase might be responsible for enhance the residence time over cornea and might be due to transcorneal penetration occurs. Bioadhesive effect of the Mod.CH was resulted to an enhancement of the corneal permeability most probably concurrent to the polycationic nature of chitosan [1].
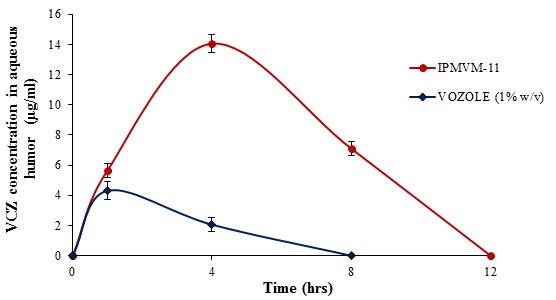 |
Fig. (6). VCZ Concentration in Aqueous Humor with Time Profile of IPMVM-11 and VOZOLE (1% w/v) in Rabbits. |
3.3.11.2. Evaluation of Fungal Keratitis and Topical Therapy
Ocular irritancy and topical therapy studies were carried out for the assessment of the results obtained with healthy rabbits. In this study, the effectiveness of ME (IPMVM-11) was investigated in fungal keratitis induced rabbit eyes. Candida albicans was used to produce fungal keratitis. The fungal keratitis in all experimental rabbit groups was confirmed after 18 hours and topical therapy was initiates with IPMVM-11 and marketed formulation (VOZOLE (1% w/v)). The treatment for infected groups (group 1 and 2) were proceeding with two drops (1 drop ≈ 50 µl) at every 12 hour for a day, during 1 week. In addition, group of 3 rabbit (control group) was induced Candida albicans treated with sterile physiological saline solution, however not applied any other therapy. Images during treatment of infected rabbit eyes with Candida albicans after 0, 24, 72 and 168 hours with treatment (VOZOLE (1% w/v) and IPMVM-11) and without treatment (control) were illustrated in Fig. (7).
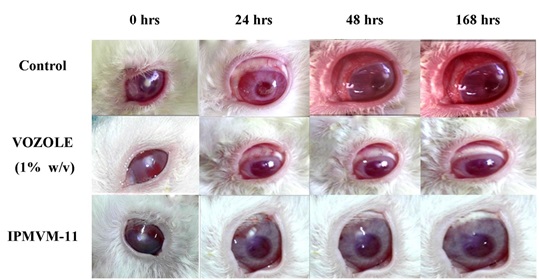 |
Fig. (7). Images during treatment of infected rabbit eyes with Candida albicans after 0, 24, 72 and 168 hrs with VOZOLE (1% w/v) and IPMVM-11. |
3.3.11.3. Clinical Grading of Ocular Inflammation
Modified draize test performed for evaluation of rabbit eyes with representation of clinical grading system. During treatment the conjunctival redness was studied and depicted in Table 6. The control group of rabbits showed considerably higher grades than VOZOLE (1% w/v) and IPMVM-11. The clinical grading system carried out throughout 7 days study of 24, 72 and 168 hours. After 24 hours, the score of the control group was 2.96 ± 0.22 whereas score of VOZOLE (1% w/v) and IPMVM-11 was 2.44 ± 0.34 and 1.82 ± 0.47 respectively. After 72 hours, the score of the control group was 3.00 ± 0.00 whereas score of VOZOLE (1% w/v) and IPMVM-11 was 2.03 ± 0.43 and 0.93 ± 0.54 respectively. After 168 hours, the score of the control group was 3.00 ± 0.00 whereas score of VOZOLE (1% w/v) and IPMVM-11 was 1.10 ± 0.46 and 0.29 ± 0.16 respectively. The clinical grading system also depicted in Table 4.In addition IPMVM-11 applied rabbits, established lower scores than VOZOLE (1% w/v) applied rabbits in all clinical signs. This occurrence was deliberated to be due to the enhancement of residence time of drug on cornea and the concentration drug in aqueous humor was maintained higher from IPMVM-11 than VOZOLE(1% w/v).
| Groups | Clinical scores for conjunctival redness | ||
|---|---|---|---|
| 24 hrs | 72 hrs | 168 hrs | |
| Control | 2.96 ± 0.22 | 3.00 ± 0.00 | 3.00 ± 0.00 |
| VOZOLE (1% w/v) | 2.44 ± 0.34 | 2.03 ± 0.43 | 1.10 ± 0.46 |
| IPMVM-11 | 1.82 ± 0.47 | 0.93 ± 0.54 | 0.29 ± 0.16 |
CONCLUSION
The pseudo-ternary phase diagrams and area of existence of o/w microemulsions for three different oils (oleic acid/isopropyl myristate/isopropyl palmitate), Smix (tween 80: propylene glycol) and water were delineated. O/W microemulsion can be potential ocular delivery system of lipophilic candidate i.e. voriconazole. Voriconazole microemulsions containing Mod.CH (0.25% w/v) were successfully prepared and evaluated for different parameters. The developed VCZMEs showed acceptable physicochemical properties i.e. characterized by mean droplet size below 250 nm for all formulations with good PDI and positive zeta potential. The positive zeta potential helpful for prolongs precorneal residence time. Voriconazole microemulsion containing Mod.CH (0.25% w/v) was able to provide sustained release and would be acts as alternative to eye drop for the treatment of ocular fungal keratitis.
CONFLICT OF INTEREST
The authors confirm that this article content has no conflict of interest.
ACKNOWLEDGEMENTS
The authors are grateful to Matrix Lab. Pvt. Ltd. Hyderabad for providing voriconazole as a gift sample.