RESEARCH ARTICLE
Development and Validation of a Robust QSAR Model For Piperazine and Keto Piperazine Derivatives as Renin Inhibitors
Jimish R. Patel*, Laxman M. Prajapati
Article Information

Identifiers and Pagination:
Year: 2016Volume: 3
First Page: 1
Last Page: 24
Publisher Id: PHARMSCI-3-1
DOI: 10.2174/1874-844901603010601
Article History:
Received Date: 22/07/2015Revision Received Date: 9/02/2016
Acceptance Date: 17/02/2016
Electronic publication date: 31/03/2016
Collection year: 2016
open-access license: This is an open access article licensed under the terms of the Creative Commons Attribution-Non-Commercial 4.0 International Public License (CC BY-NC 4.0) (https://creativecommons.org/licenses/by-nc/4.0/legalcode), which permits unrestricted, non-commercial use, distribution and reproduction in any medium, provided the work is properly cited.
Abstract
Background:
The renin is a key performer in the renin–angiotensin system, and it offers a resource for the beneficial action of hypertension and heart malfunction. The keto piperazine based renin inhibitors have shown greater potential and good biavaibility.
Objective:
To develop a highly efficient QSAR model for 80 piperazines and keto piperazines to predict renin enzyme inhibitory activity.
Methods:
The renin inhibitory activity (IC50) was considered as biological activity. Dragon software, version 5.5 was used for calculation of physicochemical parameters. Sequential MLR (multiple linear regression) is carried out to create quantitative structure–activity relationship models, which were again evaluated in support of statistical significance and analytical capacity by inner and exterior validation.
Results:
The greatest QSAR model was a correlation coefficient (R2) of 0.846, cross-validation correlation coefficient (Q2) of 0.818 and, R2 pred of 0.821. The leave one out cross validation method was used to assess the performance of the chosen model.
Conclusion:
The quantitative structure–activity relationship model suggests that the constitutional descriptors (Sv, nDB, nO) play a vital role in binding of ligands with renin enzyme. The information presented provides important structural insight in designing more potent renin enzyme inhibitors.
INTRODUCTION
The renin–angiotensin–aldosterone system (RAAS) is a key controller of blood pressure; it has a reno-protective function and a very significant position in the vascular reaction to the damage [1]. Renin is aspartic protease, which consists of one of the four key classes of peptide cleave enzymes [2]. It is concealed by the nephron in feedback to reduce circulation level and blood pressure. Renin cleaves the substrate angiotensinogen to provide the stationary angiotensin-I. Angiotensin converting enzymes convert Angiotensin-I to the pro-hypertensive agent angiotensin receptor blockers. The renin is an input performer in the renin–angiotensin structure, and its operation offers a resource used for the beneficial action of hypertension and heart malfunction.
Renin hang-up is an eye-catching object for drug involvement due to its notable specificity intended for its substrate [3, 4]. The key man-made molecules were peptide or peptide-like renin inhibitors remikiren and zanikiren showing poor oral bioavailability, quick elimination, little efficiency, and high rate of chemical synthesis. Just utilizing the combination of drug design and crystallographic structure analysis led to the development of aliskiren, non-peptide orally effective inhibitor of human renin [5-9].
Pfizer pursued the task of designing the keto piperazine based renin inhibitors which have shown greater potential [10, 11]. More recently, a novel series of renin inhibitors based on the 3, 9-diazabicyclo nonene have been developed [12]. The piperazine and keto piperazine derivatives have been found to be potent, efficacious, oral and good bioavailable renin inhibitors [11, 13, 14]. In this study, novel quantitative structure–activity relationship models were built to illustrate the magnitude of the physicochemical properties intended for the piperazine and keto piperazine derivatives as renin inhibitors.
MATERIALS AND METHODS
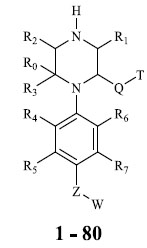
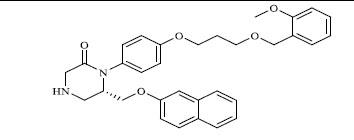
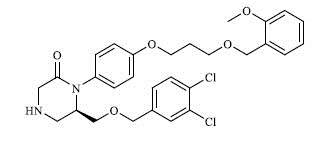
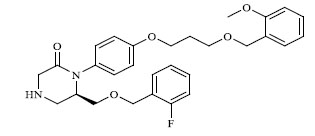
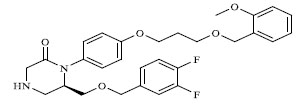
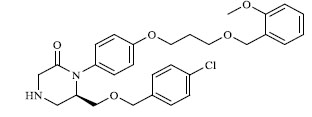
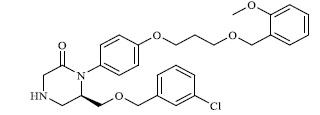
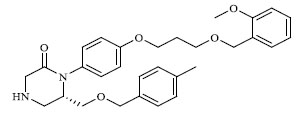
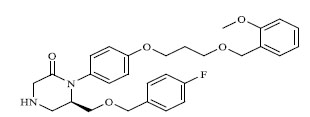
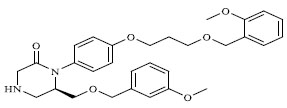
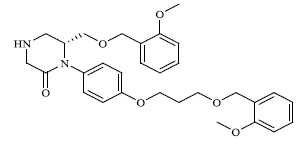
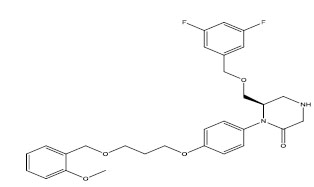
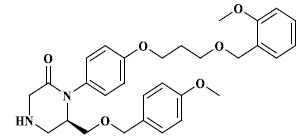
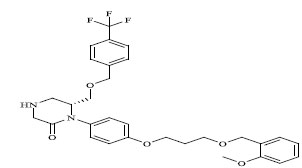
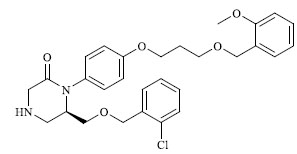
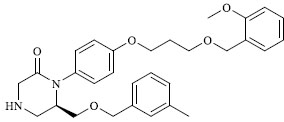
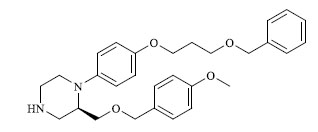
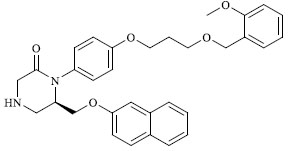
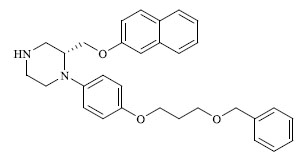
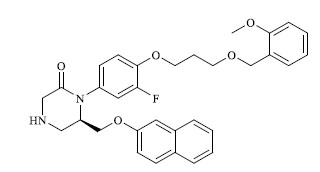
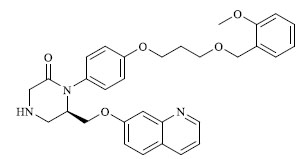
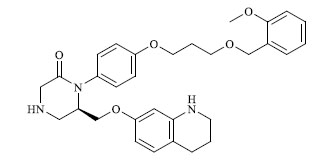
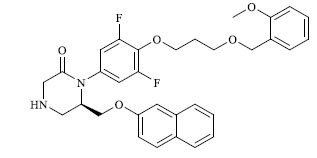
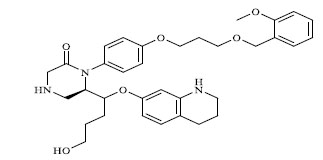
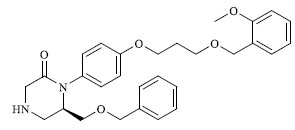
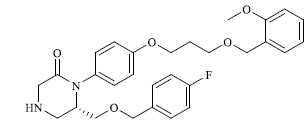
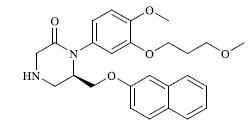
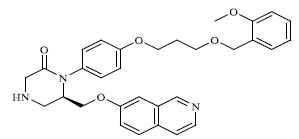
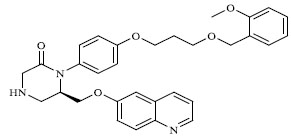
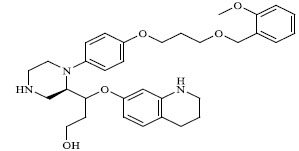
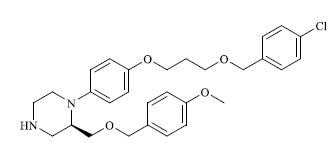
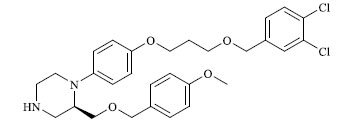
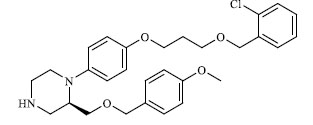
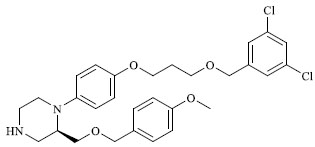
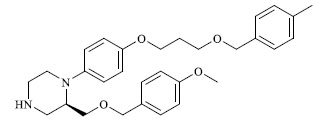
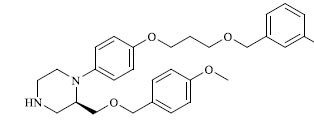
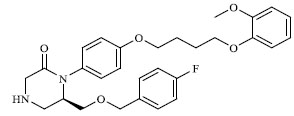
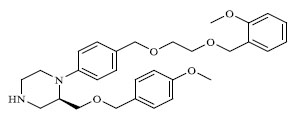
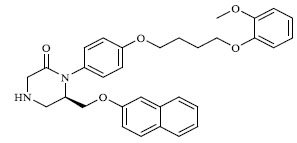
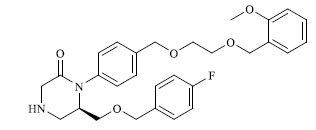
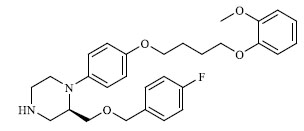
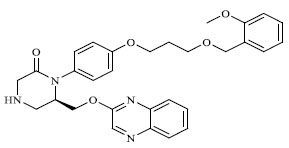
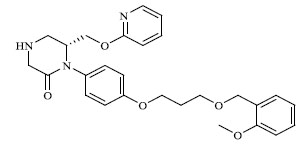
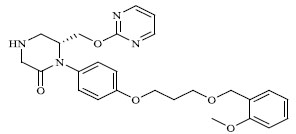
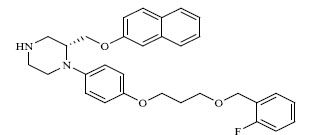
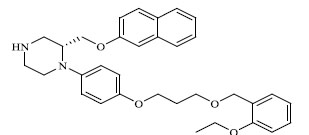
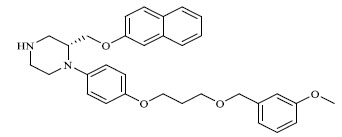
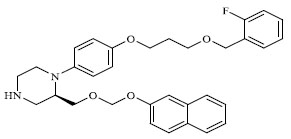
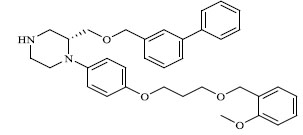
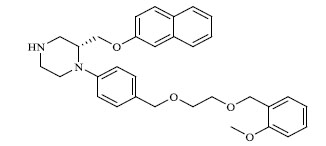
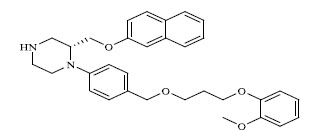
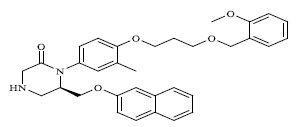
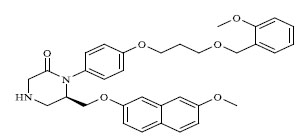
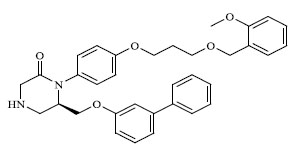
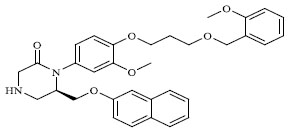
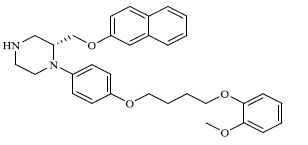
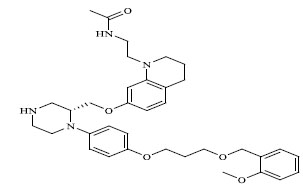
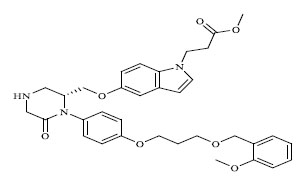
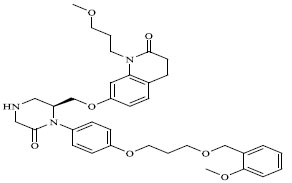
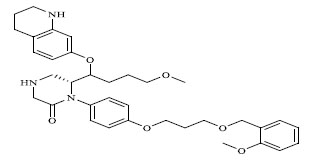
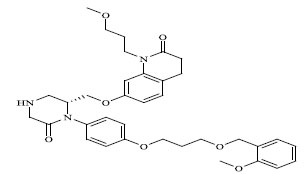
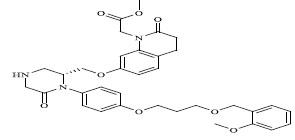
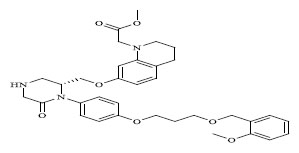
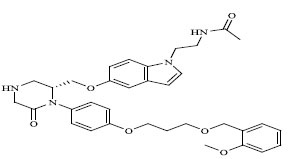
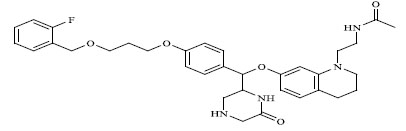
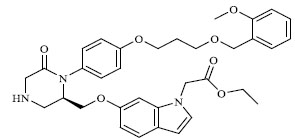
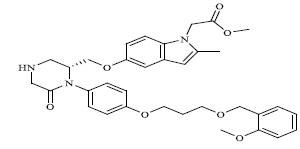
A total of 80 piperazine and keto piperazine based renin inhibitors were included in Quantitative structure–activity relationship study as accounted in Table 1 [13]. IC50 (µM) values changed in logarithmic (M) values, which were used for the regression studies.
Molecules 's Structures and Experimental values of piperazine and keto piperazine based renin enzyme inhibitors.
| No. | Compound `s Structures | IC50(µM) Experimental |
|---|---|---|
| 1 |
|
0.066 |
| 2 |
|
0.181 |
| 3 |
|
0.225 |
| 4 |
|
0.246 |
| 5 |
|
0.295 |
| 6 |
|
0.325 |
| 7 |
|
0.337 |
| 8 |
|
0.454 |
| 9 |
|
0.612 |
| 10 |
|
0.880 |
| 11 |
|
1.573 |
| 12 |
|
3.864 |
| 13 |
|
0.068 |
| 14 |
|
0.223 |
| 15 |
|
0.372 |
| 16 |
|
0.107 |
| 17 |
|
0.132 |
| 18 |
|
0.00042 |
| 19 |
|
3.990 |
| 20 |
|
10.900 |
| 21 |
|
0.054 |
| 22 |
|
1.420 |
| 23 |
|
0.152 |
| 24 |
|
0.822 |
| 25 |
|
0.124 |
| 26 |
|
0.883 |
| 27 |
|
0.037 |
| 28 |
|
7.014 |
| 29 |
|
5.586 |
| 30 |
|
3.841 |
| 31 |
|
0.528 |
| 32 |
|
3.450 |
| 33 |
|
0.064 |
| 34 |
|
43.700 |
| 35 |
|
11.500 |
| 36 |

|
5.040 |
| 37 |
|
15.900 |
| 38 |
|
4.340 |
| 39 |
|
60.200 |
| 40 |
|
15.600 |
| 41 |
|
3.840 |
| 42 |
|
30.500 |
| 43 |
|
1.729 |
| 44 |
|
4.090 |
| 45 |
|
42.000 |
| 46 |

|
1.000 |
| 47 |
|
76.375 |
| 48 |
|
20.933 |
| 49 |
|
33.857 |
| 50 |
|
0.597 |
| 51 |
|
1.980 |
| 52 |
|
23.700 |
| 53 |
|
1.700 |
| 54 |
|
1.020 |
| 55 |
|
2.549 |
| 56 |
|
26.255 |
| 57 |
|
0.167 |
| 58 |
|
0.225 |
| 59 |
|
1.513 |
| 60 |
|
0.537 |
| 61 |
|
1.360 |
| 62 |
|
0.00017 |
| 63 |
|
0.00018 |
| 64 |
|
0.00035 |
| 65 |
|
0.00036 |
| 66 |
|
0.00053 |
| 67 |
|
0.00162 |
| 68 |
|
0.00170 |
| 69 |
|
0.00317 |
| 70 |
|
0.00391 |
| 71 |
|
0.00400 |
| 72 |
|
0.00409 |
| 73 |
|
0.00466 |
| 74 |
|
0.00500 |
| 75 |
|
0.00600 |
| 76 |
|
0.00600 |
| 77 |
|
0.00683 |
| 78 |
|
0.00900 |
| 79 |
|
0.00959 |
| 80 |
|
0.01000 |
Molecules were randomly divided into the test set (24 molecules) and training set (56 molecules). The 2D structures were converted into 3D structures by using software Chem Office 2004, Version 8.0 [15]. The energy minimization was executed in two steps, in the first step energy minimized using molecular mechanics-2 (MM2) until the root mean square (RMS) gradient value attained the value smaller than 0.100 kcal/mol Å and then in second step minimized molecules were subjected to re-optimization by MOPAC (Molecular Orbital Package) module using the AM1 procedure foreclosed shell system until the RMS gradient reached a value smaller than 0.0001kcal/mol Å. Total 3224 molecular descriptors were calculated on the DRAGON Software, Version 5.5 (Table 2) [16].
calculate values of various descriptors intended for the compounds
| NO. | aSv | bnDB | cnO |
|---|---|---|---|
| 1 | 46.11 | 1 | 5 |
| 2 | 44.51 | 1 | 5 |
| 3 | 43.22 | 1 | 5 |
| 4 | 43.33 | 1 | 5 |
| 5 | 43.81 | 1 | 5 |
| 6 | 43.81 | 1 | 5 |
| 7 | 44.71 | 1 | 5 |
| 8 | 43.22 | 1 | 5 |
| 9 | 45.22 | 1 | 6 |
| 10 | 45.22 | 1 | 6 |
| 11 | 43.33 | 1 | 5 |
| 12 | 45.22 | 1 | 6 |
| 13 | 45.04 | 1 | 5 |
| 14 | 43.81 | 1 | 5 |
| 15 | 44.71 | 1 | 5 |
| 16 | 45.74 | 1 | 5 |
| 17 | 45.15 | 1 | 5 |
| 18 | 53.52 | 2 | 7 |
| 19 | 45.31 | 0 | 5 |
| 20 | 43.2 | 0 | 4 |
| 21 | 46.11 | 1 | 5 |
| 22 | 44.09 | 0 | 3 |
| 23 | 46.22 | 1 | 5 |
| 24 | 45.51 | 1 | 5 |
| 25 | 46.7 | 1 | 5 |
| 26 | 46.33 | 1 | 5 |
| 27 | 52.01 | 1 | 6 |
| 28 | 43.11 | 1 | 5 |
| 29 | 43.22 | 1 | 5 |
| 30 | 38.92 | 1 | 5 |
| 31 | 45.51 | 1 | 5 |
| 32 | 45.51 | 1 | 5 |
| 33 | 50.5 | 0 | 5 |
| 34 | 43.9 | 0 | 4 |
| 35 | 44.6 | 0 | 4 |
| 36 | 43.9 | 0 | 4 |
| 37 | 43.9 | 0 | 4 |
| 38 | 44.6 | 0 | 4 |
| 39 | 44.8 | 0 | 4 |
| 40 | 45.31 | 0 | 5 |
| 41 | 43.22 | 1 | 5 |
| 42 | 45.31 | 0 | 5 |
| 43 | 46.11 | 1 | 5 |
| 44 | 43.22 | 1 | 5 |
| 45 | 43.31 | 0 | 4 |
| 46 | 44.9 | 1 | 5 |
| 47 | 40.31 | 1 | 5 |
| 48 | 40.91 | 1 | 5 |
| 49 | 40.31 | 1 | 5 |
| 50 | 44.2 | 0 | 3 |
| 51 | 47.8 | 0 | 4 |
| 52 | 46.2 | 0 | 4 |
| 53 | 46.31 | 0 | 4 |
| 54 | 50.39 | 0 | 4 |
| 55 | 46.2 | 0 | 4 |
| 56 | 46.2 | 0 | 4 |
| 57 | 47.71 | 1 | 5 |
| 58 | 48.22 | 1 | 6 |
| 59 | 48.71 | 1 | 5 |
| 60 | 48.22 | 1 | 6 |
| 61 | 46.2 | 0 | 4 |
| 62 | 52.92 | 3 | 8 |
| 63 | 53.01 | 2 | 7 |
| 64 | 53.01 | 2 | 7 |
| 65 | 53.52 | 2 | 7 |
| 66 | 54.09 | 1 | 5 |
| 67 | 51.32 | 2 | 7 |
| 68 | 53.52 | 2 | 7 |
| 69 | 53.61 | 1 | 6 |
| 70 | 53.52 | 2 | 7 |
| 71 | 51.84 | 3 | 8 |
| 72 | 51.92 | 2 | 7 |
| 73 | 51.81 | 2 | 6 |
| 74 | 52 | 2 | 5 |
| 75 | 51.32 | 2 | 7 |
| 76 | 51.32 | 2 | 7 |
| 77 | 50.75 | 3 | 9 |
| 78 | 55.12 | 2 | 7 |
| 79 | 51.92 | 2 | 7 |
| 80 | 49.73 | 2 | 7 |
Development of Quantitative structure–activity relationship model was carried out by sequential MLR method using VALSTAT program [17]. The validation of Quantitative structure–activity relationship models “Leave-one-out (LOO)” method was utilized. The greatest model was chosen on the basis of various statistical parameters such as correlation coefficient (R), square of correlation coefficient (R2), sequential Fischer test (F). The correlative and predictive ability of the each model was estimated from the cross-validated squared correlation coefficient (Q2), standard deviation of prediction (SPRESS), and standard deviation of error of prediction (SDEP). Bootstrapping square correlation coefficient (R2bt) was calculated which authenticate the robustness and applicability of QSAR equation. The derived QSAR model was applied for the prediction of the activity values of the compounds in the test set and the exterior validation parameter, predictive R2 (R2pred) was calculated to assess the predictive capacity of the model. Various rm2 metrics were also calculated to validate the model further on stringent condition [18, 19].
The Z score method was adopted for the finding of outliers. Z score can be explaining as an absolute difference between the value of the model and the activity field, divided by the square root of the mean square error of the data set. Any compound having a Z score higher than 2.5, during generation of a particular QSAR model, is measured as an outlier.
RESULT AND DISCUSSION
In current study authors tried to develop a Quantitative structure–activity relationship model to clarify the correlation between physicochemical parameters and renin inhibitors. A data set of 80 piperazine and keto piperazine based renin inhibitors was used in the present study.
Several equations were raised when data set subjected to sequential multiple linear regression analysis. Out of these the most statistically significant equation was regarded as the best model.
BA= [-3.16542( ± 2.41293)] + Sv [0.217772( ± 0.0590015)] + nDB [1.19936( ± 0.437316)] + nO [-0.322083( ± 0.322204)]
The statistical parameters for this model are presented in Table 3. The model presented above was considered as the best model due to its overall predictivity. The inter correlation between few descriptors was found to be high (Table 4), which could be owing to synergistically interacting descriptors. Furthermore, the multicollinearity arising from utilization of correlated descriptors is not a serious problem as assumed often. There are several examples of cases where pairs of highly correlated, descriptors generated the highly significant regression equations [20-24].
Quantitative structure–activity relationship statistics of important equation#.
| Parameters | Statistical values |
|---|---|
| N Train | 56 |
| N test | 24 |
| NV | 3 |
| R | 0.920 |
| R2 | 0.846 |
| Variance | 0.335 |
| Std | 0.578 |
| F | 95.465 |
| R2bt | 0.852 |
| Chance | <0.001 |
| Q2 | 0.818 |
| SPRESS | 0.629 |
| SDEP | 0.606 |
| R2pred | 0.821 |
| rm2 (Loo) | 0.799 |
| rm2 (Predicated) | 0.675 |
| rm2(Overall) | 0.782 |
Correlation among structural descriptors and with the activity.
| Parameters | logIC50(M) | Sv | nDB | nO |
|---|---|---|---|---|
| logIC50(M) | 1 | |||
| Sv | 0.838511 | 1 | ||
| nDB | 0.786293 | 0.594754 | 1 | |
| nO | 0.751425 | 0.673352 | 0.911668 | 1 |
The model displays a good (R) of 0.920 between the descriptors Sv, nDB, nO for rennin binding affinity. The squared (R2) of 0.846 indicates 84.6 % of the variance in the biological activity. This model also illustrates significance level more than 95% with F value =95.465, a low standard deviation of estimation 0.578, establish the accuracy of the model. The stability of the model evaluated by leave-one-out method is literally superior (Q2 > 0.6) suggesting the effectiveness of model for consequential predictions. The robustness of model was shown by magnitude of the R2bt (0.852), which was close to conventional R20.846). Additional help in this regard was found from the small values of the cross-validation parameters SPRESS and SDEP. The predicted R2 value of the test sets was 0.821, representing brilliant predictive capacity of the model. The calculated, predicted and observed values of biological activity are exposed in Table 5 and Table 6 respectively. The association between predicted activity (LOO) and observed of the training and test set is shown in Fig. (1).
Comparative biological activity [logIC50 (M)] of the training set.
| Compound no. | Observed activity | Calculated activity | Predicted activity |
|---|---|---|---|
| 1 | 7.180 | 6.465 | 6.446 |
| 2 | 6.742 | 6.117 | 6.095 |
| 3 | 6.648 | 5.836 | 5.793 |
| 4 | 6.609 | 5.860 | 5.821 |
| 6 | 6.488 | 5.964 | 5.941 |
| 7 | 6.472 | 6.160 | 6.150 |
| 9 | 6.213 | 5.949 | 5.928 |
| 10 | 6.056 | 5.949 | 5.941 |
| 11 | 5.803 | 5.860 | 5.863 |
| 13 | 7.167 | 6.232 | 6.203 |
| 14 | 6.652 | 5.964 | 5.934 |
| 16 | 6.971 | 6.384 | 6.369 |
| 17 | 6.879 | 6.256 | 6.237 |
| 19 | 5.399 | 5.091 | 5.053 |
| 20 | 4.963 | 4.954 | 4.954 |
| 22 | 5.848 | 5.470 | 5.421 |
| 25 | 6.907 | 6.594 | 6.585 |
| 27 | 7.432 | 7.428 | 7.427 |
| 28 | 5.154 | 5.812 | 5.848 |
| 29 | 5.253 | 5.836 | 5.867 |
| 32 | 5.462 | 6.334 | 6.359 |
| 33 | 7.194 | 6.222 | 6.054 |
| 34 | 4.360 | 5.106 | 5.139 |
| 36 | 5.298 | 5.106 | 5.098 |
| 37 | 4.799 | 5.106 | 5.120 |
| 38 | 5.363 | 5.259 | 5.254 |
| 40 | 4.807 | 5.091 | 5.127 |
| 41 | 5.416 | 5.836 | 5.858 |
| 42 | 4.516 | 5.091 | 5.163 |
| 43 | 5.762 | 6.465 | 6.484 |
| 44 | 5.388 | 5.836 | 5.859 |
| 45 | 4.377 | 4.978 | 5.006 |
| 49 | 4.470 | 5.202 | 5.301 |
| 50 | 6.224 | 5.494 | 5.398 |
| 52 | 4.625 | 5.607 | 5.660 |
| 53 | 5.770 | 5.631 | 5.624 |
| 54 | 5.991 | 6.520 | 6.604 |
| 55 | 5.594 | 5.607 | 5.608 |
| 56 | 4.581 | 5.607 | 5.662 |
| 60 | 6.270 | 6.602 | 6.618 |
| 61 | 5.866 | 5.607 | 5.594 |
| 62 | 9.770 | 9.381 | 9.329 |
| 65 | 9.444 | 8.634 | 8.571 |
| 67 | 8.790 | 8.155 | 8.121 |
| 68 | 8.770 | 8.634 | 8.623 |
| 69 | 8.499 | 7.776 | 7.685 |
| 70 | 8.408 | 8.634 | 8.651 |
| 71 | 8.398 | 9.145 | 9.246 |
| 73 | 8.332 | 8.584 | 8.613 |
| 74 | 8.301 | 8.947 | 9.247 |
| 75 | 8.222 | 8.155 | 8.151 |
| 76 | 8.222 | 8.155 | 8.151 |
| 77 | 8.166 | 8.586 | 8.703 |
| 78 | 8.046 | 8.982 | 9.090 |
| 79 | 8.018 | 8.285 | 8.301 |
| 80 | 8.000 | 7.809 | 7.798 |
Comparative biological activity [logIC50 (M)] of the test set.
| Compound no. | Observed activity | Predicted activity |
|---|---|---|
| 5 | 6.530 | 5.964 |
| 8 | 6.343 | 5.836 |
| 12 | 5.413 | 5.949 |
| 15 | 6.429 | 6.160 |
| 18 | 9.377 | 8.634 |
| 21 | 7.268 | 6.465 |
| 23 | 6.818 | 6.489 |
| 24 | 6.085 | 6.334 |
| 26 | 6.054 | 6.513 |
| 30 | 5.416 | 4.899 |
| 31 | 6.277 | 6.334 |
| 35 | 4.939 | 5.259 |
| 39 | 4.220 | 5.302 |
| 46 | 6.000 | 6.202 |
| 47 | 4.117 | 5.202 |
| 48 | 4.679 | 5.333 |
| 51 | 5.703 | 5.956 |
| 57 | 6.777 | 6.813 |
| 58 | 6.648 | 6.602 |
| 59 | 5.820 | 7.031 |
| 63 | 9.745 | 8.523 |
| 64 | 9.456 | 8.523 |
| 66 | 9.276 | 8.203 |
| 72 | 8.388 | 8.285 |
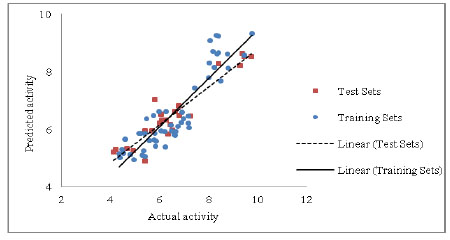 |
Fig. (1). Chart of actual activity vs. predicted activity for the training set and test set. |
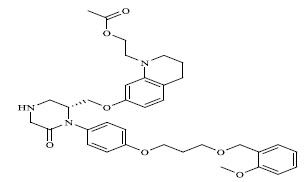
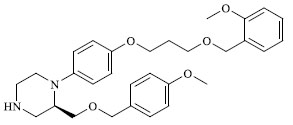
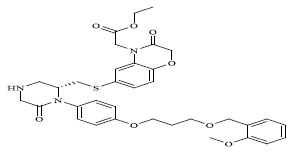
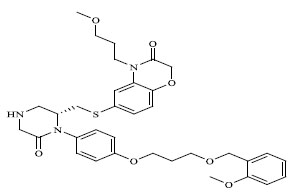
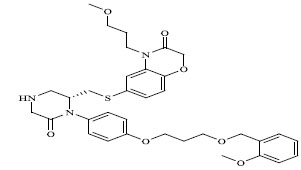
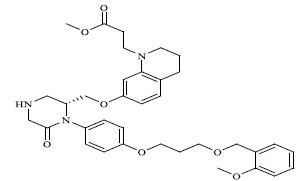
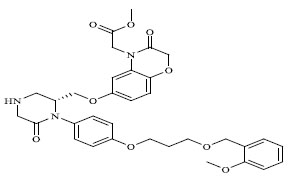
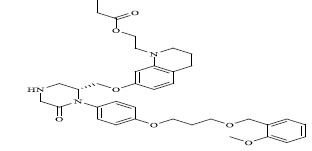
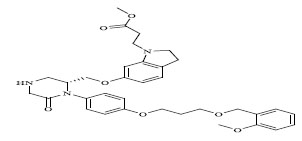
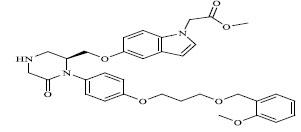
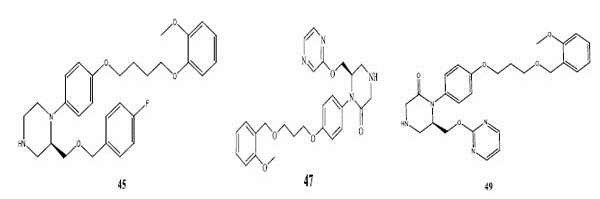
The QSAR study revealed that Sv and nDB descriptors have positive involvement to the renin inhibitory activity while nO has negative contribution to the renin inhibitory activity. All the three descriptors are 0D-constitutional indices, which are independent from molecular connectivity and conformations [25]. The predominant positive effect of Sv can be seen by observing the most potent compounds (compound no. 18 and 62-65). All these compounds have benzo-oxazine moiety with ester or ether side chain or tetrahydro quinoline with amide side chain, which provide bulkiness to molecule as shown in Fig. (2).
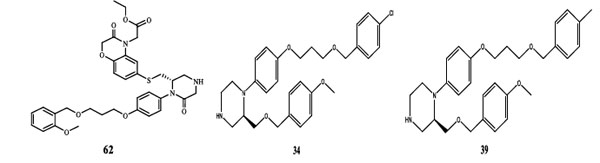 |
Fig. (2). Structures of most potent compound (62) and least potent compound (34, 39, 45, 47, and 49). |
There are hydrophobic and hydrophilic amino acids both in the renin molecule. The hydrophilic amino acids are found outside the molecule, while the hydrophobic amino acids tends to be more on the inner side. The hydrophobic amino acids form the active site, a large hydrophobic pocket which can cover a molecule with minimum seven residues. Hydrogen bonding is the prime link between a renin and the ligand [26, 27]. For efficient and specific binding, the receptor cavity, in most cases, must be tightly filled with the interacting ligand. The increased van der Waals volumes could be helping the drug to place the drug residue in close proximate with amino acids in the hydrophobic pocket. The least potent compounds (compound no. 34, 39, 47, 49) are free from bulkiness provided by benzo-oxazine moiety or quinoline rings in Fig. (2). Positive contribution of nDB indicates that introduction of extra aromatic/heterocyclic ring or doubly bonded hetero atom increases the binding affinity. It is clearly seen that all the most potent compounds have extra one or two carbonyl group either as an ester or an amide. The little negative effect of descriptor nO is due to replacement of ether linkage between piperazine and benzoxazine ring, with thioether in most potent compounds (compound no. 62 and 63).
CONCLUSION
A developed QSAR model for piperazines and keto piperazines was found to be robust and accurate. This model can be used for designing the novel renin enzyme inhibitors in future.
CONFLICT OF INTEREST
The authors confirm that this article content has no conflict of interest.
ACKNOWLEDGEMENTS
Declared none.