RESEARCH ARTICLE
Analytical Methods for Determination of Muscle Relax-ant Thiocolchicoside in Pharmaceutical Preparations- A Review
J.K. Rajput, P.H. Patil, S. J. Surana, A. A. Shirkhedkar*
Article Information
Identifiers and Pagination:
Year: 2015Volume: 2
First Page: 43
Last Page: 55
Publisher Id: PHARMSCI-2-43
DOI: 10.2174/1874844901502010043
Article History:
Received Date: 15/5/2015Revision Received Date: 1/8/2015
Acceptance Date: 29/9/2015
Electronic publication date: 8/12/2015
Collection year: 2015
open-access license: This is an open access article licensed under the terms of the (https://creativecommons.org/licenses/by/4.0/legalcode), which permits unrestricted, noncommercial use, distribution and reproduction in any medium, provided the work is properly cited.
Abstract
Thiocolchicoside is a centrally acting muscle relaxant and used in combination with many NSAIDs for the treatment of various musculoskeletal disorders. As it is less sedative than other centrally acting muscle relaxants hence frequently prescribed for low back pain (LBP), orthopedic, traumatic and rheumatologic disorders. It is available in market in single component and as multicomponent formulations. Various analytical methods are available for determination of thiocolchico-side in drug substances and formulated products. The present article summarizes more than 100 analytical methods including all types of chromatographic, UV-Visible spectrophotometry and radio immune assays with their percentage of utility for de-termination of thiocolchicoside in biological matrices, bulk material and different pharmaceutical formulations.
INTRODUCTION
Thiocolchicoside (THC) is a semisynthetic derivative of cholchicoside (natural compound) which is obtained from the seeds of Gloriosa superb and Colchicum autumnale. It is an analogue of colchicines, as they share the same benzo (alpha) heptalenic moiety [1]. It is used as muscle relaxant for the treatment of painful muscle contractions in acute and chronic rheumatic conditions, in traumatology and in patients with acute low back pain [2]. Moreover, Anti-inflammatory and analgesic effects of this drug have also been reported in animal models [3]. It is used since several years in the European countries, but in India the first formulation containing thiocolchicoside was approved in the year 2008 [4]. THC is available in combination therapy with many NSAIDs for treatment of acute low back pain and painful muscle spasms.
CHEMISTRY
Thiocolchicoside (THC) (Fig. 1) is a 2-Glucoside analog of Thiocolchicine and known as 2-demethoxy-2- glucosidoxy thiocolchicine. The Molecular formula is C27H33NO10S; and molecular weight is 563.62 g it occurs as yellow crystalline powder and is soluble in water, methanol, 0.1N HCl, 0.1N NaOH. It contains not less than 98.0 per cent and not more than 102.0 per cent of C27H33NO10S. Thiocolchicine is chemically, N-(7S)-5,6,7,9-Tetrahydro-1,2,3-trimethoxy-10-(methylthio)-9-oxabenzoa heptalen-7-yl acetamide and its semi-synthetic derivative THC is, N-(7S)-2-(3,4,5-trihydroxy-6-hydroxymethyl-tetrahydropyran-2-yloxy)-5,6, 7,9-Tetrahydro-1,3-dimethoxy-10-(methylthio)-9-oxabenzo aheptalen-7-ylacetamide [5].
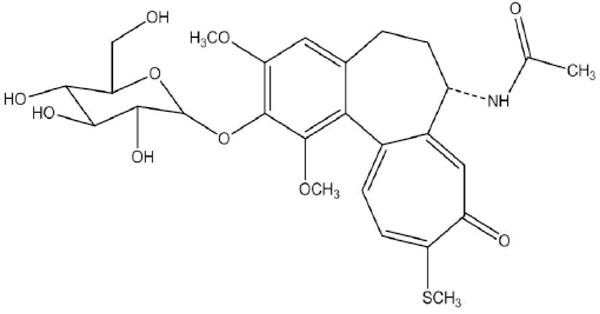 |
Fig. (1). Chemical structure of thiocolchicoside. |
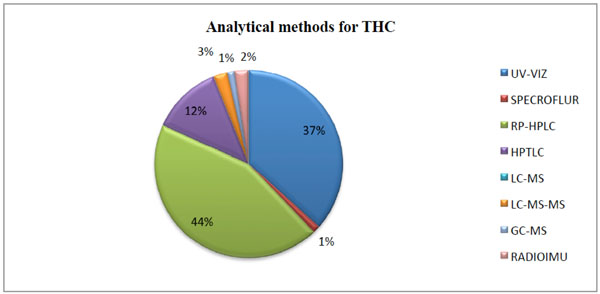 |
Fig. (2). Different analytical methods employed for determination of thiocolchicoside. |
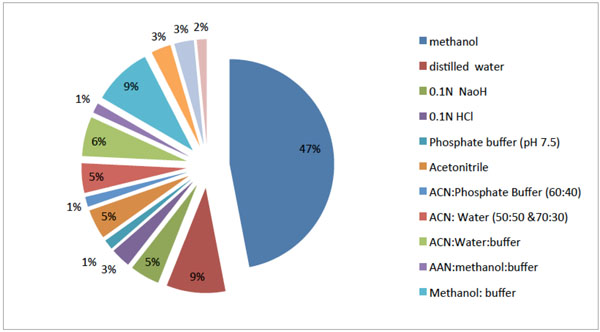 |
Fig. (3). Diluents used for the analysis of THC in different analytical methods. |
Spectrophotometric methods used for determination of thiocolchicoside alone and in combined dosage form.
| Sr. No. | Name of drug | Sample matrix | Method | Detection (λ max) nm |
Linearity range | Comments | Ref. | |
|---|---|---|---|---|---|---|---|---|
| 1 | THC | Capsule | A | Zero order | 259.0 nm | THC- 2.5 – 50 µg/mL | Simple and accurate | [13] |
| B | First order | 252.0 nm | ||||||
| C | Second order | 260.0 nm | ||||||
| D | AUC | 254.0 -264.0 nm | ||||||
| 2 | THC | Capsule | A | Zero order | 259.8 nm | Simple and economical | [14] | |
| B | AUC | 269.8-259.8 nm | ||||||
| 3 | THC | Capsule | Zero order | 257.0 nm | THC-2-38 mg/mL | Simple | [15] | |
| 4 | THC+DCF | Capsule | A | Q-value/Analysis | 264 nm and 259 nm | THC- 2-40 µg/mL DCF- 1-50 µg/mL |
Economic | [16] |
| B | Simultaneous equation | |||||||
| 5 | THC+DCF | Tablets | A | Absorption correction | 264.99 nm and 373.84 nm | DCF-25-75 µg/mL THC-4-12 µg/mL |
Higher linearity range | [17] |
| B | Area Under Curve (AUC) | DCF 252.56-260.59 nm and THC 278.51-285.53 nm |
||||||
| 6 | THC+DCF | Tablets | A | Ratio Derivative | 268.78 and 355.62 nm | 12.5-75 μg/m1 | Different linearity and complex | [18] |
| B | Dual Wavelength | 252.47nm and 260.74 nm | 25-75 μg/mL | |||||
| 7 | THC+DCF | Capsule | Simultaneous equation | 259 nm and 277nm | THC 4 - 24 µg/mL & DCF 10 - 60 µg/mL |
Simple and economical | [19] | |
| 8 | THC+DCF | Capsule | Multicomponent mode | 254,259,265,271,286 | THC-20-100µg/mL and DCF-20-100 µg/mL |
Economical | [20] | |
| 9 | THC+DCF | Capsule | A | Absorbance correction method | 276.6 nm and 372.8 nm | DCF-5‐30 μg/mL and THC-10‐60μg/mL |
Sensitive | [21] |
| B | First order derivative | 278.6 nm and 243.2 nm | ||||||
| C | Dual wavelength | 244nm and 269 nm | ||||||
| 10 | THC+DCF | Capsule | A | Simultaneous Equation method | 260.0 nm THC and 276.5 nm DCF | THC-1-10 µg/mL and DCF-6.25-62.5 µg/mL | Easy and economical | [22] |
| B | Absorbance Correction method | 276.5 nm DCF, 373.0 nm is isoabsorptive point of THC | ||||||
| 11 | THC+ DCF | Capsule | A | absorption correction method | THC-397.80 nm and DCF- 271.0 nm | THC-5-35 µg/mL and 10-70 µg/mL |
Accurate | [23] |
| 12 | THC+ ACE |
Tablet | A | AUC | 264.5-254.5 nm for THC and 279.0-269.0 nm for ACE |
THC and DCF- 4-36 µg/mL | Precise and selective | [24] |
| 13 | THC+ ETD |
Tablet | Absorbance Ratio Method | 260 nm and 232nm | ETD-15-100µg/mL and THC-2-20µg/mL |
Selective | [25] | |
| 14 | THC+ DXKET | Tablet | Absorbance correction | 370 nm and 255 nm | THC 4-40µg/mL and DKET 5-50µg/mL | Accurate and sensitive | [26] | |
| First order derivative | 232 nm and 242 nm | |||||||
| 15 | THC+ KET | Tablet | First order derivative | THC 233.0 nm and KET 243.0 nm |
THC- 3-15 µg/mL and KET-12-60 µg/mL |
Simple and selective | [27] | |
| Absorbance correction | THC 372.0 nm, KET 260.0 nm. |
THC-1-5µg/mL and KET- 10-50 µg/mL |
||||||
| 16 | PCM+ THC+ ACE |
Tablet | Multicomponent mode | PCM-256 nm, THC 258 nm, ACE 270 nm. |
PCM- 1-25 µg/mL, THC- 2.5-25 µg/mL and ACE- 1-25 µg/mL |
Economical | [28] | |
| 17 | PCM+ THC+ ACE |
Tablet | Multicomponent mode | PCM 249 nm, THC 258 nm, ACE 276 nm. |
PCM -5-25 µg/mL THC-1-5 µg/mL and ACE- 1-5 µg/mL |
Economical | [29] | |
| 18 | THC | Injection | Spectrofluorimetry | 289 nm and 366 nm. | THC-1-10µg/mL | Specific | [30] | |
HPLC methods for Thiocolchicoside.
| Sr. No. | Name of drug | Sample matrix | Mobile phase composition | Detection (λ max) nm |
Linearity | Rt (in. min) |
Ref. | |
|---|---|---|---|---|---|---|---|---|
| 1 | THC+GF | Tablet MIX-I |
Methanol : 0.035 M phosphate buffer (50:50, v/v) pH 4.5 | 400 | THC-0.2 – 2 µg/mL GF and FN -20–200 µg/mL |
THC-2.56 GF-4.5 |
Good resolution with low Rt | [31] |
| THC+ FN |
Tablet MIX-II |
Methanol: 0.03M phosphate buffer (70:30, v/v), pH 4 | THC-3.84 FN-5.88 |
|||||
| 2 | THC+ACE | Tablets | Acetonitrile: Water: Methanol (70:20:10, v/v) | 260 | THC-4 - 20 µg/mL ACE-40-200µg/mL |
THC-3.36 ACE-4.12 |
Low Rt and Robust | [32] |
| 3 | THC+ACE | Tablets | Acetonitrile: Water: 0.025M pot. dihydrogen orthophosphate buffer (pH adjusted to 3.0 with OPA) (70:10:20, v/v) |
260 | THC-1-6 µg/mL ACE-25-150µg/mL |
THC-2.70 ACE-4.76 |
Simple and sensitive | [33] |
| 4 | THC+ACE | Tablets | Phosphate buffer :Acetonitrile (40:60 v/v) | 261 | THC 2 - 12 µg/mL ACE 25-150µg/mL |
THC-2.17 ACE-4.80 |
Simple mobile phase | [34] |
| 5 | THC+ACE | Tablets | Acetonitrile: buffer of pH 6 (42:58,v/v) | 261 | ACE 25-125 μg/mL THC 1-6 μg/mL |
THC-4.15 ACE-4.88 |
Low resolution | [35] |
| 6 | THC+DCF | Capsules | Acetonitrile: Methanol: Water (35:15; 50, v/v), pH adjusted to 3.5 with orthophosphoric acid. |
286 | THC 10-100 μg/mL DCF- 20-100 μg/mL |
THC-3.3 DCF-4.0 |
Low resolution | [36] |
| 7 | THC+DCF | Tablet | Water (pH 9.2adjusted with di- Potassium hydrogen Phosphate) (60: 40, v/v) | 223 | THC 50-150 μg/mL DCF- 50-150 μg/mL |
DCF-3.229 THC-4.999 | Low resolution | [37] |
| 8 | THC+LOR | Tablets | Methanol: THF: acetate buffer (60: 10: 30, v/v); pH adjusted to 5.5 with glacial acetic acid | 250 | LOR 0.2 to 80μg/mL THC 0.1 to 40μg/mL | LOR-.4.08 THC- 3.36 |
Low resolution | [38] |
| 9 | THC+LOR | Tablet | Methanol: Acetate buffer (PH-4.6) :THF(50:35:15, v/v) | 375 | LOR -4-100μg/mL THC-2-50μg/mL | LOR-.400 THC- 2.92 |
Complex mobile phase | [39] |
| 10 | THC+LOR | Tablet | Ammonium Dihydrogen Phosphate buffer (pH 7.3 with TEA): Methanol (45:55,v/v) | 290 | LOR-0.24 - 120µg/mL THC-0.23 - 120µg/mL | LOR -9.40 THC-2.96 |
Time consuming | [40] |
| 11 | THC+LOR | Tablet | Sodium Phosphate buffer( pH 6.8 adjusted with NaOH): ACN (35:65% v/v) | 298 | LOR - 1- 50 μg/mL THC-5 - 25 μg/mL |
LOR -4.50 THC -3.40 |
Low resolution | [41] |
| 12 | THC+KET | Tablet | Acetonitrile: Water: Phosphate buffer (pH 3.0) (60:30:10, v/v) | 260 | THC-4-20µg/mL KET-20-100µg/mL |
THC-2.70 KET-4.90 |
Low resolution | [42] |
| 13 | THC+KET | Tablet | Acetonitrile: Water (60:40,v/v) |
300 | KET-80-120μg/mL THC-6.4-9.6μg/mL | THC-3.7± 0.1 KET-7.90±0.1 |
Economical and good resolution | [43] |
| 14 | THC+DXKET | Tablet | Methanol: Sodium acetate buffer (pH 5 with Glacial acetic acid) (70:30, v/v) | 265 | DXKET-5-30µg/mL THC-1 –10 µg/mL |
THC-3.0133 DXKET 6.013 |
Economical And well separation |
[44] |
| 15 | THC+DXKET | Tablet | Methanol: Phosphate buffer (pH adjusted to 4.5 with OPA) (65:35 v/v) |
260 | THC 4-24 µg/mL DXKET-5-30 µg/mL |
THC-3.02 DXK 8.91 |
Economical and well separation | [45] |
| 16 | THC+ETR | Tablet | Trifluoroacetic acid buffer (pH 2.6): Acetonitrile (75:25, v/v) | 220 | ETR 20-160µg/mL THC 2 -16 µg/mL |
ETR-6.6 THC-3.1 | Simple | [46] |
| 17 | THC+ETR | Tablet | 1 mL TFA in 2 liter milli-Q water) and Acetonitrile (75:25 v/v) | 258 | ETR 1.598-90µg/mL THC 4.95-12µg/mL | THC-3.37 ETR-8.62 |
Simple | [47] |
| 18 | THC+ETR | Tablet | Phosphate buffer (pH 6, adjusted with orthophosphoric acid) and Methanol (30:70 v/v) |
255 | ETR 40-80 µg/mL THC 2-6 µg/mL |
THC-2.50 ETR-4.60 | Robust | [48] |
| 19 | THC+ETD | Tablet | Methanol and Phosphate buffer pH 6, (85:15 v/v) | 259 | ETD 16-96 µg/mL THC 4-24 µg/mL |
ETD4.39±0.10 THC3.52±0.10 | Simple mobile phase but less separation | [49] |
| 20 | THC+ETD | Tablet | Acetonitrile: 20mM potassium dihydrogen phosphate buffer (65:35 v/v) | 257 | ETD 25-150 µg/mL THC 0.5-10 µg/mL | THC-2.240 ETD-7.141 |
Robust, Good resolution |
[50] |
| 21 | THC+ETD | Tablet | Acetonitrile: Potassium dihydrogen phosphate buffer (pH 3.0) (50:50, v/v) | 255 | ETD 100-600µg/mL THC 1-6 µg/mL |
ETD-4.27 THC-2.6 | high linearity values | [51] |
| 22 | THC+PCM | Tablet | Potassium Dihydrogen phosphate: Methanol (40:60, v/v) | 247 | PCM 250-750µg/mL THC 1-3µg/mL |
PCM-3.27 THC-5.50 |
Economical with low Rt | [52] |
| 23 | THC+ ACE+ PCM |
Tablet | Acetonitrile: Water (30: 70, v/v) | 263 | PCM-50-175 µg/mL ACE-10-35 µg/mL THC-0.40-1.4 µg/mL |
PCM- 2.51 THC-3.55 ACE -5.20 |
Simple and economical | [53] |
| 24 | THC+ ACE+ PCM |
Buffer of pH 6.5 and Acetonitrile in Gradient elution. | 300 | PCM 1250-3750 µg/mL, THC 20-60 µg/ mL ACE 250-750 µg/ mL |
PCM- 2.70 THC-3.95 ACE -9.91 |
Well resolution | [54] |
HPLC chromatographic columns and optimized analytical parameters.
| Sr. No. |
Name of drug | Column | Internal diameter and Partical Size | Temp. | Detector | Flow rate | Mode of analysis | Diluents | Ref. |
|---|---|---|---|---|---|---|---|---|---|
| 1 | THC+GF | C18 (Waters symmetry) |
i.d.-250×4.6mm; 5-µm |
RT | UV detector | 1mL/min | Isocratic | Methanol | [31] |
| THC+FN | |||||||||
| 2 | THC+ACE | C18 (Intersil) | 250 mm x 4.6 mm, 20-µm | RT | Variable wavelength detector | 1mL/min | Gradient | Methanol | [32] |
| 3 | THC+ACE | C18(Thermo) | i.d-250x4.6 mm;5-µm | Ambient | UV detector | 1mL/min | Isocratic | M.P | [33] |
| 4 | THC+ACE | C18 (Waters symmetry) |
i.d.-150×4.6mm; 5-µm |
RT | UV detector | 1mL/min | Isocratic | Methanol | [34] |
| 5 | THC+ACE | C18 (Thermo Hypersil BDS) |
i.d.-250X4.6 mm; 5µm | RT | diode array detector | 0.6mL/min. | Isocratic | MP | [35] |
| 6 | THC+DCF | C18 (Intersil) | i.d.-250 x 4.6 mm;5µm | RT | Variable wavelength detector | 1mL/min | Gradient | Water | [36] |
| 7 | THC+DCF | C18 (Waters Symmetry) | i.d.250X4.6 ;5µm |
30oC | PDA detector | 1mL/min | Isocratic | M.P | [37] |
| 8 | THC+LOR | C18 (Waters Symmetry) | i.d.-250 mm × 4.6 mm;5.0 µm | 50 0C | PDA detector | 0.75mL/min | Isocratic | MP | [38] |
| 9 | THC+LOR | C18(Varian) | i.d.-250 mm x 4.6 mm ; 5 µm | 25± 30C. | UV detector | 0.5 mL/min | isocratic | Methanol | [39] |
| 10 | THC+LOR | C18 (Inertsil ODS 3V) |
i.d.-250 x 4.6 mm; 5 µm | 30ºC | PDA detector | 1.5 mL/min | isocratic | MP | [40] |
| 11 | THC+LOR | C8 (X terra) , | i.d.-4.6 x 250mm; 5 µm, | Ambient | UV detector | 1mL/min | isocratic | MP | [41] |
| 12 | THC+KET | C18 (Thermo scientific) |
i.d.-250×4.6 mm; 5μm | 25 ±1 oC | UV detector | 1mL/min | Isocratic | MP | [42] |
| 13 | THC+ KET |
C18 | i.d.-150 x 4.6 mm; 5μm | RT | UV detector | 1mL/min. | Isocratic | MP | [43] |
| 14 | THC+ DXKET |
C18 (HS, HiQ sil) |
i.d.-250 x 4.6 mm; 5μm |
Ambient | PDA detector | 1mL/min. | Isocratic | MP | [44] |
| 15 | THC+DXKET | RP-18e (Purosphere STAR) |
i.d.-250× 4mm ;5μm | RT | UV detector | 1.0 mL/min. | Isocratic | MP | [45] |
| 16 | THC+ETR | C-18 (BDS Hypersil) |
i.d.-250 X4.6 mm; 5-µm. | Ambient | UV detector | 1.5 mL/min | Isocratic | MP | [46] |
| 17 | THC+ETR | C18 (RP-select B Lichrospher) |
i.d.-250 x4.6mm;5 µm | --- | PDA | 1.5 mL/min | Isocratic | MP | [47] |
| 18 | THC+ETR | C18 (InertSil ODS-3) | i.d.-250x4.6 mm; 5µm | -- | UV detector | 1.2 mL/min | Isocratic | MP | [48] |
| 19 | THC+ETD | C-18 (Phenomenex) | i.d.-250 mm × 4.60 mm; 5 µm | -- | UV detector | 0.8mL/ min | Isocratic | MP | [49] |
| 20 | THC+ETD | C18 (HiQ sil HS) | i.d-250 x 4.6 mm; 5 µm |
Ambient | UV detector | 1mL/min | Isocratic | MP | [50] |
| 21 | THC+ETD | C18 (Symmetry) | i.d.-150X4.6 mm ;5µm | 25 ±10C | UV detector | 1.0 mL/min | Isocratic | Methanol | [51] |
| 22 | THC+ PCM |
C18 (BDS hypersil) | i.d.-250mm × 4.6mm, 5µm | Ambient | UV detector | 1.0 mL/min | Isocratic | MP | [52] |
| 23 | THC+ACE+PCM | C18 (HiQ Sil) | i.d.-250 mm × 4.6 mm, 5.0 µm | Ambient | UV detector | 1.0 mL/min | Isocratic | Methanol | [53] |
| 24 | THC+ ACE+ PCM |
C18 (inertsil ODS) | i.d-150x4.6mm ;5 µm |
Ambient | PDA detector | 1.0 mL/min | Gradient | MP | [54] |
HPTLC methods for determination of thiocolchicoside.
| Sr. No. |
Name of Drug | Sample matrix | Mobile phase composition | Detection (λmax) nm | Linearity | Rf | Comments | Ref. |
|---|---|---|---|---|---|---|---|---|
| 1 | THC+DCF | Capsule | Toluene: Ethyl acetate: Methanol (5:3:2 v/v) | 285 | 50-300 ng/band for both | THC-0.17 DCF-0.53 |
Simple and economical | [55] |
| 2 | THC+DCF | Capsule | Toluene: Acetone: Methanol: Formic acid (5:2:2:0.01 v/v/v/v) | 280 | THC 160-800 ng/band DCF 1000-5000 ng/band |
THC-0.29±0.02 DCF-0.71±0.02 | Complex mobile phase with high linearity values | [56] |
| 3 | THC+ACE | Tablet | Toluene: Ethyl acetate: Methanol: Glacial acetic acid (4: 6: 2: 0.5 v/v). | 255 | THC 6–21 ng/band ACE 10-35 ng/band |
THC 0.16 ACE 0.79 |
High resolution | [57] |
| 4 | THC+ACE | Tablet | Methanol:Chloroform: Water 9.6:0.2:0.2 v/v) |
254 | 30–180 ng/band THC 750–4500 ng/band ACE |
THC 0.70 ± 0.05 ACE 0.83 ± 0.05 | Solvents with diverse polarity | [58] |
| 5 | THC+ACE | Methanol: Chloroform: Water (9.6: 0.2: 0.2 v/v) | 254 | THC 30-180 ng/band ACE 750-4500 ng/band | THC 0.70 ± 0.05 ACE 0.83 ± 0.05 |
Low resolution | [59] | |
| 6 | THC+DXKET | Tablet | Toluene: Methanol: Ethyl Acetate (6: 2.5: 0.5, v/v) | 280 | THC-100-800 ng/band DXKET-600-4800 ng/band |
THC 0.33± 0.011 DXKET 0.61 ± 0.007 |
High linearity range | [60] |
| 7 | THC+DXKET | Tablet | Toluene: Ethyl acetate: Methanol (5:3:2 v/v) | 286 | THC-50-350 ng/band DXKET-100-700 ng/band |
THC 0.10 DXKET 0.40 |
Low Rf of THC (not acceptable) | [61] |
| 8 | THC+LOR | Tablet | Methanol:Chloroform: Water (9.6:0.2:0.2 v/v) |
377 | THC 30-180 ng/band LOR 60-360 9ng/band |
THC 0.58±0.05 LOR 0.85±0.05 |
Water not sutable as solvent for NP | [62] |
| 9 | THC+ETR | Tablet | Ethyl acetate: Methanol (8 :2 v/v) |
290 | THC 100–500 ng/band ETR 50–250 ng/band | THC 0.17 ETR 0.70 |
Low Rf value for THC | [63] |
Stability-indicating HPLC and HPTLC methods for determination of thiocolchicoside.
| Sr.No. | Name of Drug | Sample matrix | Mobile phase | Detection (λ max) nm | Linearity | Rt/Rf | Comments | Ref. |
|---|---|---|---|---|---|---|---|---|
| 1 | THC | Capsule | Acetonitrile: Water (70:30) | 286 | THC- 0-10μg/mL | 3.35 min. | Simple | [72] |
| 2 | THC | Capsule | Acetonitrile: Phosphate Buffer pH 3.5, (70:30 % v/v) | 260 | 80-120 % of THC label claim | 2.24 min. | All parameters of forced degradation are not explored | [73] |
| 3 | THC | Capsule | Methanol:Water (70 : 30 v/v) | 377 | 100–600 ng per band. | 0.60 ± 0.02 | Simple and economical | [74] |
| 4 | THC+ETD | Tablet | Acetonitrile: Potassium dihydrogen phosphate buffer pH 6.8 (70:30% v/v) | 260 | THC-4.012 - 12.03 μg/mL ETD-249.09 -747.29μg/mL |
THC-3.05min ETD-2.10min. |
Degradation not in detail | [75] |
| 5 | THC+ACE | Tablet | Potassium phosphate monohydrate buffer (pH-5.0): Acetonitrile: Methanol in (40:20:40 % v/v) |
263 | THC -7.5 to 25μg/mL ACE-100-300µg/mL |
THC-2.8 min ACE-4.2 min |
Not completely explored | [76] |
| 6 | THC+DCF | Tablet | Solvent A (5 mM sodium dihydrogen phosphate, pH 2.5) and Solvent B (Methanol) |
258 | THC-40.48–121.43 µg/mL DCF 24.91–74 µg/mL |
THC-5.8 min. DCF-11.0 min. |
Good resolution | [77] |
| 7 | THC+DCF | Tablet | Methanol: Acetonitrile : Phosphate buffer (40:20:40 v/v at pH 5.0) | 263 | THC-7.5-25 µg/mL DCF-100-300µg/mL |
THC-2.8 min ACE-4.2 min | Separation not suitable in case of impurities | [78] |
| 8 | THC+ACE | Tablet | Methanol: Acetonitrile: THF: Acetate buffer (56:4:10:30 v/v) pH adjusted to 6.5 with Acetic acid | 312 | THC-0.4- 24 µg/mL ACE-10 -600 µg/ML |
THC-4.7 min. ACE-6.3min. |
Complex mobile phase | [79] |
| 9 | THC+ACE | Tablet | (A) 10 mM Ammonium acetate pH 5.00 buffer and (B) Acetonitrile: Water (70:30 v/v) | 265 | ACF-80-280 µg/mL THC- 6.4–22.4 µg/mL |
THC-13.29min ACF-2.20 min | Higher Rt | [80] |
| 10 | THC+ACE | Tablet | 5% ammonium acetate buffer and methanol (40:60 v/v) pH 5 with OPA | 276 | THC-4.8 -7.2 µg/mL ACE-63.8 -96 µg/mL |
THC-0.697 min. ACE-1.125 min. | Very low Rt | [81] |
| 11 | THC+ KET |
Tablet | Methanol: Toluene: Benzene (2.5:3.5:4 v/v) |
260 | 125-750 ng/band THC 1000-6000 ng/band KET |
THC 0.35 and KET 0.65 min. |
Well resolved components | [82] |
| 12 | THC+PCM+ DCF | Capsule | Acetonitrile: Phosphate buffer adjusted pH 3 with OPA | 228 | 100- 500 μg/mL PCM, THC and DCF | PCM -5.3;THC-9.61;DCF- 21.47 | Economical but not suitable as stability indicating | [83] |
PHARMACOLOGY
Mechanism of Action
THC is a centrally acting Non-benzodiazepine muscle relaxant. It acts as a weak postsynaptic GABA agonist [6]. TCC has been used clinically for more than 35 years as a muscle-relaxant, anti-inflammatory, and analgesic drug, but its molecular targets and mechanisms of action are still under investigation. This compound has been shown to inhibit the binding of [3H] GABA (g-aminobutyric acid) or [3H] strychnine to rat cerebro-cortical or spinal cord membranes, respectively, in vitro as well as to corresponding autoradiographic sections in vivo. Moreover, TCC was shown to interact preferentially with a subpopulation of GABA-ARs with low-affinity binding sites for GABA. Although its precise mechanisms of action remain unknown, TCC has been thought to act as a GABA-AR agonist that induces depression of the central nervous system and, in turn, myorelaxation [7].
Pharmacokinetics
On IM administration THC shows Cmax values of 113 ng/mL (4 mg dose) and 175 ng/mL (8 mg dose) in 30 min. After oral administration, no THC is detected in plasma. Only two metabolites were observed with maximum plasma concentrations one hour after THC administration [8].
Dosage Forms and Recommended Dose
Oral, parenteral and topical formulations of THC are available in India. The maximum recommended oral dose is 8 mg every 12 hours for not more than 7 consecutive days. The maximum intramuscular dose should be 4 mg every 12 hours, for up to 5 days [8].
Contraindications
THC is contraindicated in patients hypersensitive to the active substance, during the entire pregnancy period, during lactation and in women of childbearing potential not using contraception. The drug is also contraindicated in children less than 16 years of age [8, 9].
Adverse Effects
THC has shown some side effects like anaphylactic reactions, such as pruritus, urticaria, angioneurotic oedema; anaphylactic shock following intramuscular injection, somnolence, vasovagal syncope, usually occurring in minutes following the intramuscular injection; diarrhea, gastralgia, nausea, vomiting and allergic skin reaction and phototoxicity.
On 21st November 2013, the European Medicines Agency’s Committee on Human Medicinal Product recommended that the authorized uses for THC containing medicines for use by mouth or injection should be restricted across the European Union. In addition, the dose of thiocolchicoside by mouth or injection should be restricted [8].
Thiocolchicoside given at doses of 6–12 mg/kg is unable to induce, in intact rats, any electrical or behavioural paroxysmal activity. However, when this compound is applied topically to the pia, given by microinjection to cerebral cortex, or administered parenterally at doses of 6 mg/kg to rats with minimal lesions of the dura and arachnoid membranes, it displays within a few minutes, a powerful convulsant activity. It is also reported that thiocolchicoside presented seizures in a patient when treated with a much lower dose (0.25 mg/kg for the cumulative dose or 0.05 mg/kg for a single dose) [10, 11].
Recent Safety Alerts for Thiocolchicoside
The review of thiocolchicoside was triggered by the Italian medicines regulatory agency, AIFA, following new experimental evidence which suggested that THC was broken down in the body into a metabolite called M2 or SL59.0955 that could damage dividing cells, resulting in aneuploidy (an abnormal number or arrangement of chromosomes) [9].
ANALYTICAL METHODS FOR DETERMINATION OF THIOCOLCHICOSIDE
The analysis of pharmaceuticals is an integral part of drug development process. From many years; analytical techniques like UV/Vis-Spectrophotometry, Spectrofluorimetry, Atomic Absorption Spectrometry, Capillary-Electrophoresis, Liquid-chromatography, Gas-chromatography Mass-spectrometry, Luminescence, Voltammetry and Polarography have been studied for the analysis of pharmaceutical compounds. Amongst all these methods, chromatographic methods have been widely exploited and preferred over other methods [12]. THC is a commonly used muscle relaxant in the treatment of acute painful muscle spasms. It is available in combined treatment with many non-steroidal anti-inflammatory drugs (NSAIDs) like Aceclofenac, Diclofenac, Paracetamol, Ketoprofen, Etodolac, Etoricoxib, Lornoxicam and Floctafenine and the literature reports vast number of analytical methods such as UV-spectrophotometry, HPLC, TLC-densitometry and LC-MS/MS for the determination of THC in biological matrices, bulk material and the corresponding pharmaceutical formulations.
Consequently, the objective of the present review is to compile the analytical methods published so far for estimation of THC in biological samples including metabolites and degradants, bulk materials and pharmaceutical formulations. The percentage utility of these techniques is calculated and shown in Fig. (2), from which it can be noticed that High-Performance Liquid Chromatography (HPLC) and Spectrophotometric methods have been most extensively used. Apart from this, the present review will be useful for selecting the diluents Fig. (3) and the analytical procedure for the assay of THC with different concentrations ranges, selective accuracy and precision in various biological material or pharmaceuticals.
Spectrophotometry [13-29] and Spectrofluorimetry [30]
In the literature, nearly twenty seven UV- Spectrophotometric methods have been reported so far for estimation of THC alone and in combined dosage forms as well as a single Spectrofluorimetry method has been also established for THC from injection. Table 1 illustrates the summary of the reported UV-Spectrophotometric and Spectrofluorimetry methods indicating the basic principle, matric used, λmax, solvent and linearity range.
Methods for Analysis as a Single Component
Eight methods for estimation of THC in a capsule dosage form as a single component have been developed. The first, second and third method employ first order, second order and third order derivative spectroscopy to reduce spectral interference. The fourth method employs selection of area under curve in wavelength region of 254 – 264 nm using 0.1 N Sodium hydroxide solution prepared in double distilled water [13]. Two simple and sensitive spectrophotometric methods have been developed for the quantitative estimation of THC from its capsule formulation. The first method is a zero order UV spectrophotometric method using distilled water as solvent; the drug showed absorption maximum at 259.8 nm and linearity was observed in the concentration range of 5.0 – 50 µg/mL. The second method is area under curve selecting the wavelength range of 269.8 - 249.8 nm [14]. In other method, utilizing UV-Spectrophotometric procedure, based on the linear relationship between the THC concentration and the λmax amplitude at 279 nm [15].
Methods for Analysis in Combined Dosage form with Other Drugs
As THC is available with many NSAIDS, analgesics and antipyretics in combined pharmaceutical formulations; literature revealed range of UV-Spectrophotometric methods for simultaneous determination of THC in combined dosage forms.
Two simple, rapid, accurate and economical methods have been developed for the estimation of THC and DCF-P in capsules. The first method; involves formation of Q-absorbance equation at 264 (isoabsorptive point) and at 259 nm, while the second method; involves formation of simultaneous equation at 259 and 271 nm, using water as solvent [16].
Two methods; absorption correction and area under curve have been established for the quantitative estimation of THC and DCF-P from tablet formulation using methanol as a solvent. In absorption correction method, quantitative estimation of THC was carried out by subtracting interference of diclofenac using experimentally calculated absorption factor, also Beer’s plot was constructed for DCFP and THC in solution mixture at different concentration (25:4, 37.5:6, 50:8, 62.5:10, 75:12 µg/mL) levels. For the simultaneous equations using area under curve; 252.56 - 260.59 nm (λ1 - λ2) and 278.51 - 285.53 nm (λ3 - λ4) have been selected as a sampling wavelength ranges for estimation of DCFP and THC [17].
Two methods for simultaneous determination of DCFP with THC in combined dosage form have been developed. The first method is based on first derivative of the ratio spectra (1DD) measuring the amplitudes at 268.78 nm and 355.62 nm. For the second method, two wavelengths were selected for each drug in a way so that the difference in absorbance is zero for another drug [18]. A simple method employed the formation and solving of simultaneous equation using 259 nm and 277 nm as the wavelength for forming equation has been also developed for DCFP with THC using 0.1 N NaOH as a solvent [19]. A single method, using multicomponent mode of analysis of the instrument is used for the simultaneous estimation of the two drugs THC and DCF-P respectively [20]. Three spectrophotometric methods (A–C) were described for simultaneous determination of THC with DCF-S in capsule formulation. The first ‘method A’ is absorbance correction method and determines concentration of DCFS directly from calibration plot by measuring absorbance at 276.6 nm and THC was determined after correction for absorbance of DCF-S at 372.8 nm. The second method is based on first order derivative spectroscopy to overcome spectral interference from other drug and wavelengths 278.6 nm and 243.2 nm were selected for the determination of the DCFS and THC, respectively. In the third method, diclofenac sodium was determined by plotting the difference in absorbance at 244 and 269 nm (difference is zero for THC) against the concentration of DCFS. Similarly for the determination of THC, the difference in absorbance at 266.8nm and 290 nm (difference is zero for DCFS) was plotted against the concentration of DCFS [21].
Two methods for simultaneous estimation of THC and DCFP in combined dosage form have been described. In the first method; the wavelengths 276.5 nm (λmax of DCFP) and
373.0 nm (where DCFP does not interfere in absorbance of THC) were selected for analysis by proposed method, while the second method; involves formation of simultaneous equation at 260 and 275.5 nm, using 0.1 N NaOH as solvent [22].
A simple UV-Spectrophotometric absorption correction method has been reported, which is based upon determination of THC at 397.80 nm and DCF-P at 271.0 nm, in distilled water [23].
Only one AUC method is available for simultaneous analysis of THC with ACE. The method employed selection of area under curve in wavelength region of 264.5 - 254.5 nm for THC; 279.0 - 269.0 nm for Aceclofenac and solving the equations [24].
An absorbance ratio (Q-analysis) UV spectrophotometric method has been developed for the simultaneous determination of THC and ETD from the combined tablet dosage form using 232nm as isoabsorptive point and 0.1 N HCl as solvent [25]. Two methods, i.e. Absorbance correction and First order derivative spectroscopy are also reported for simultaneous estimation of THC with DXKET using methanol as solvent. The amount of drug determined by proposed methods ranges from 99.8 to 100.2 % for both. The method reports recovery study values of THC and DXKET 99.8% and 100.2%, respectively for both the methods with RSD less than 2 %. [26] Few other methods, First order derivative spectroscopic (% label claimed 99.94 % for THC and 99.60 % for KET) and Absorbance correction method (% label claimed 100.32 % for THC and 99.95 % for KET) is presented in literature for estimation of THC with KET using distilled water as solvent [27]. Two methods using multicomponent mode of analysis are also reported for THC in combined dosage form with PCM and ACE. The accuracy of the both methods was evaluated by percentage recovery (by standard addition method) of all three drugs and it was in the range of 99.84 - 101 % with values for SD and % RSD of < 2% [28, 29].
A single Spectroflurometric method was reported for estimation THC in injection which is based on the oxidation of THC with cerium (IV) to produce cerium (III), whose fluorescence was monitored at 366 nm [30].
Chromatography
High-Performance Liquid-Chromatography (HPLC) [31-54]
About Twenty four HPLC methods were reported for determination THC in combined pharmaceutical formulations. Table 2. shows the summary of the reported HPLC methods indicating the mobile phase used for determination, sample matric, λmax and linearity (r2).
Table 3. Summarizes the column with specifications for analysis by HPLC methods along with the conditions used such as flow rate, temperature, detector, analysis type etc.
High-Performance Thin-layer Chromatography [55-63]
Nine simple HPTLC methods have been reported for simultaneous estimation of THC in combined dosage form with ACE, DCF, DXKET, LOR, ETR and ETD. Table 4. shows the summary of the reported HPTLC methods.
Estimation of THC Using Hyphenated Techniques and in Biological Matrices
In Hyphenated techniques, Liquid-chromatography (LC), Gas-chromatography (GC) or capillary electrophoresis is linked to spectroscopic techniques, e.g. MS, FT-IR, NMR etc. resulting in new advanced techniques like CE-MS, GC-MS, MS-MS, LC-MS LC-MS-MS LC-NMR etc. Such techniques provide structural information and identification of drugs and degradation compounds. Amongst these analytical techniques, LC-MS is reported to be extensively used technique. An LC-ESI–MSn analysis is performed for forced degradation study of THC to assess its inherent chemical stability. Method reports five degradation products of THC and the degradants were characterized by MS, NMR and IR spectroscopic techniques confirming it by synthesis of degradants. The study elucidated that hydrolysis and oxidation are major degradation pathways for THC. Five degradation products were resulted and the DPs were:D1SO-(N-1,2-dimethoxy-10-methyl sulphoxide-9-oxo-3-(3,4,5-trihydroxy-6 hydroxymethyl- tetrahydropyran-2-yloxy)-5,6,7,9-tetrahydro-benzoa heptalen-7-yl-acetamide), D1SO2-(N-1,2-dimethoxy-10-methylsulphone-9-oxo-3-(3,4,5-trihydroxy-6-hydroxymethy-ltetrahydropyran-2-yloxy)-5,6,7,9-tetrahydro-benzoaheptalen- 7-yl-acetamide), D2(1,2-dimethoxy-10-methylsulphanyl-9-oxo-3-(3,4,5-trihydroxy-6-hydroxymethyl-tetrahydropyran-2-yloxy)-5,6,7,9-tetrahydro-benzoaheptalen-7-yl-amine), D3 (N-1,2-dimethoxy-3-hydroxy-10-methylsulphanyl-9-oxo-5,6,7,9-tetrahydro-benzoaheptalen-7-yl-acetamide or 3-O-demethylthiocolchicine), D4 (1,2-dimethoxy-3-hydroxy-10-methylsulphanyl-9-oxo-5,6,7,9-tetrahydro-benzo aheptalen-7-yl-amine or N-deacetyl-3-O-demethy-lthiocochicine). Products D1SO and D3 could be considered as the indicators of THC stability and they will be introduced in the development and validation of HPLC–UV stability-indicating methods for determination of THC in drug substance and drug product [64].
Quantitative determination of drugs and their metabolites from biological matrices such as blood, plasma, serum, or urine play vital role in drug discovery and development. Chromatographic methods like HPLC or GC have been widely used for the bioanalysis of small molecules and Liquid-Chromatography coupled with Triple Quadrupole Mass Spectrometry (LC/MS/MS) is the single most commonly used technology amongst it. A highly sensitive Liquid-Chromatography–tandem Mass Spectrometry (LC-MS-MS) method has been illustrated for the determination of 3-desmethylthiocolchicine in human plasma to evaluate the bioequivalence of thiocolchicoside after oral administration. The study divulge that thiocolchicoside is rapidly converted to 3-desmethylthiocolchicine (possibly partially in the acidic stomach juices) during absorption and during the first-pass effect through the liver [65]. A radioimmunoassay technique is also reported in literature to study the single-dose bioavailability of thiocolchicoside by oral and intramuscular route. This method report to relative bioavailability of both oral formulations was approximately 25%, compared to the intramuscular formulation. An another study based on radioimmunoassay using cross-reacting colchicines- specific polyclonal antibodies and 3H colchicines as marker is also depicted. In the study cross-reactivity tests were performed for some colchicine analogues, but not for
3-desmethyl thiocolchicine (aglycone part of thiocolchicoside) [66]. Similarly, a capillary gas chromatography-mass spectrometry (GC-MS) method is presented for THC following enzymatic hydrolysis of thiocolchicoside to its aglycone (3-demethylthiocolchicine). The study reports oral bioavailability of the capsule formulation was 1.06 +/- 0.39 relative to the tablet formulation [67].
A bioequivalence study has been reported for fixed dose combination of thiocolchicoside and lornoxicam in twenty four healthy male volunteers using liquid chromatography–tandem mass spectrometry (LC-MS-MS) method [68]. Similarly, a bioanalytical method is also reported for simultaneous determination of THC and lornoxicam from pharmaceutical formulation in human plasma which uses an isocratic RP-HPLC method [69].
A bioanalytical method for the simultaneous estimation of active metabolite of thiocolchicoside (3-demythylthiocolchicine) and diclofenac in human plasma by means of LC-MS/MS is also reported. The method employed Reversed-Phase phenomenex gemini C18 column with a mobile phase containing Methanol: Water (containing 0.2% formic acid) (9:1, v/v). The calibration curves were linear over the range of 1 to 50 ng/mL for 3-demythylthiocolchicine and 25 to 2500 ng/mL for DCF with the lower limit of quantification validated at 0.5 ng/mL for 3-demythylthiocolchicine and 5 ng/mL for DCF [70].
One UV-spectrophotometric method was found for simultaneous estimation of THC with ETD using methanol as solvent by simultaneous equation and Q-absorbance ratio method in tablets and in spiked human urine. The authors have also performed force degradation study for both drugs and reported that THC is only subjected to alkaline hydrolysis indicating change in λmax of THC. The authors also compared their proposed method with reference method from literature and concluded that, the present method is better than the existing reference method because 0.1 N NaOH is used in reference method which can be responsible for degradation of THC in alkaline medium and interfere with the λmax of THC [71].
Stability-Indicating Methods (SIM) for Determination of THC [72-83]
About thirteen stability-indicating methods have been reported for determination of THC in bulk substances and pharmaceutical formulations using different analytical techniques. Among it, three methods are for estimation of THC alone and ten of them described for stability-indicating nature of method for combined dosage form. Maximum of 14-15% were reported using HPLC, 3-4 % were based on HPTLC and 1 - 2% were LC/MS methods. Table 5. shows the reported stability-indicating methods for THC; illustrating sample matrix, λmax, linearity range and retention time/factor.
Official Methods for Analysis of Thiocolchicoside [84]
THC is official drug in Indian Pharmacopoeia 2010. Two HPLC methods are described for assay of THC from pharmaceutical formulations and its related substances.
CONCLUSION
The present review epitomizes numerous analytical methods applied for the determination of THC. A great number of studies including UV/Vis-Spectrophotometry, Spectrofluorimetry, HPLC, HPTLC, LC-ESI-MS, LC-MS, GC-MS etc. were reported for analysis of thiocolchicoside in bulk and in its combined pharmaceutical formulations as well as in plasma. It has been found that Liquid-Chromatography with UV-detection is the most studied for the determination of THC in bulk as well as pharmaceutical dosage forms while LC-MS and LC-MS/MS are the widely used for its estimation from plasma and other biological fluids to determine its pharmacokinetics as well as for bioavailability and bioequivalence studies. Few chromatographic methods like HPTLC and GC-MS are also published in literature. Certain Spectrophotometric methods in UV–Visible as well as fluorimetry are most often used for quantification of THC.
ABBREVIATIONS
CONFLICT OF INTEREST
The authors confirm that this article content has no conflict of interest.
ACKNOWLEDGEMENTS
The authors are thankful to Dr. S.J. Surana, Principal R. C. Patel Institute of Pharmaceutical Education and Research for providing necessary facilities.


