RESEARCH ARTICLE
Structural Features of Quercetin Derivatives by Using Pharmaco-phore Modeling Approach
Nixon Mendez, Md. Afroz Alam*
Article Information

Identifiers and Pagination:
Year: 2016Volume: 3
First Page: 79
Last Page: 98
Publisher Id: PHARMSCI-3-79
DOI: 10.2174/1874844901603010079
Article History:
Received Date: 22/5/2015Revision Received Date: 12/4/2016
Acceptance Date: 15/4/2016
Electronic publication date: 06/06/2016
Collection year: 2016
open-access license: This is an open access article licensed under the terms of the Creative Commons Attribution-Non-Commercial 4.0 International Public License (CC BY-NC 4.0) (https://creativecommons.org/licenses/by-nc/4.0/legalcode), which permits unrestricted, non-commercial use, distribution and reproduction in any medium, provided the work is properly cited.
Abstract
Background:
Quercetin which is a natural occurring flavonoid, exert a direct pro-apoptotic effect on tumor cells by blocking the growth of several cancer cell lines at different phases of the cell cycle. Quercetin derivatives have attracted considerable attention for their cytotoxity against human cancer cell lines. In this study the derivatives of Quercetin were used for docking followed by pharmacophore modeling for studying the 3D features and configurations responsible for biological activity of structurally diverse compounds.
Objective:
To develop a model which depicts the crucial structural features responsible for anti-lung cancer activities.
Method:
A robust pharmacophore developed for the receptor have been analyzed to identify potential areas of selectivity in the hyperspace of 3D pharmacophores that may lead to the discovery of anti-lung cancer drug or such compounds which could serve as templates for the design of new molecules as potential anti lung cancer agents.
Results:
The generated best pharmacophore hypothesis yielded a statistically significant 3D-QSAR model, with a correlation coefficient of R2 = 0.86 for training set and R2 = 0.76 for the test set molecules. The Cross validation regression coefficient is Q2 = 0.84 for training set and Q2 = 0.5 for test set molecules.
Conclusion:
The R2 and Q2 reveals that pharmacophore model provide insights into the structural and chemical features of the EGFR inhibitors of Quercetin derivatives that can be used as lead compound for further synthesis as well as for screening other similar novel inhibitors of EGFR.
1. INTRODUCTION
Lung cancer is the leading cause of cancer deaths worldwide among both men and women, with more than 1.8 million cases have been reported in 2012. Non–small cell lung cancer (NSCLC) accounts for about 80% of all lung cancers with an incidence of over 2,00,000 new cases per year and a very high mortality rate [1]. Lung tumors can be divided into two histological groups: non-small cell lung cancer (NSCLC) (80.4%) and small cell lung cancer (SCLC) (16.8%). NSCLC, consisting mainly of adenocarcinoma, squamous cell and large cell carcinoma, accounting for almost 80% of lung cancer cases, whereas SCLC is slightly more common and all known cases are due to cigarette smoking [2].
Lung cancer can be diagnosed in the initial stages, after the initial diagnosis, accurate staging of non–small cell lung cancer using computed tomography or positron emission tomography is crucial for determining appropriate therapy. When feasible, surgical resection remains the single most consistent and successful option for cure. However, close to 70% of patients with lung cancer are present with locally advanced or metastatic disease at the time of diagnosis. Chemotherapy is beneficial for patients with metastatic disease, and the administration of concurrent chemotherapy and radiation is indicated for stage III lung cancer. The introduction of angiogenesis, epidermal growth factor receptor inhibitors, and other new anticancer agents is changing the present and future of this disease and will certainly increase the number of lung cancer survivors [3].
In recent years structure-based approach has made possible, by knowledge of the structure of the target from crystallography, a ligand-based approach like 3D pharmacophores which may provide an alternative and complementary tool for drug design. [4] Ligand-based drug design (or indirect drug design) relies on knowledge of other molecules that bind to the biological target of interest. These other molecules may be used to derive a pharmacophore model that defines the minimum necessary structural characteristics a molecule must possess in order to bind to the target [5].
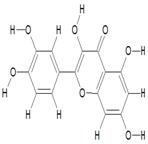
List of compounds.
Structure of Quercetin (C15H10O7)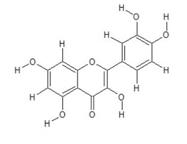
|
||||
|---|---|---|---|---|
| S.No | Compound Name | Structure | IC50 (μM) | Reference |
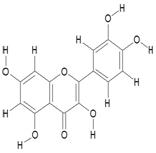
| 1. | 3,3',4',5,7-Pentahydroxyflavone (C15H10O7) |
 |
8.9 | [14] |
| 2. | 5-Morfolinohydroxypropoxy Quercetin (C24H27NO9) |
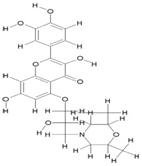 |
200 | [15] |
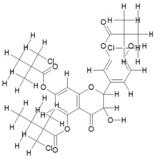
| 3. | Chloronaphtoquinone Quercetin (C25H13CLO9) |
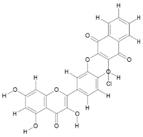 |
28.4 | [15] |
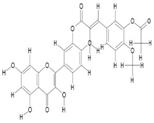
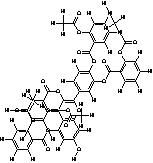
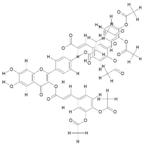
| 4. | Di(Diacethylcaffeoyl)-Mono(Monoacethylcaffeoyl) Quercetin (C53H40O21) |
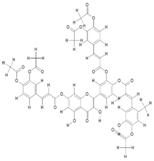 |
200 | [16] |
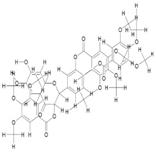
| 5. | Di(tetraacetylquinoyl) Quercetin (C45H26O25) |
 |
63.7 | [15] |
| 6. | Diquercetin (C30H18O14) |
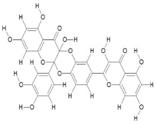 |
58.8 | [15] |
| 7. | Monoacethyl-Di(diacethylcaffeoyl) Quercetin (C43H32O18) |
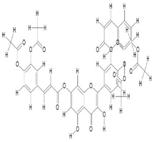 |
29.2 | [16] |
| 8. | Monoacetylferuloyl Quercetin (C27H20O11) |
 |
200 | [15] |
| 9. | Monochloropivaloyl Quercetin (C20H17CLO8) |
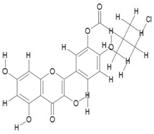 |
270.2 | [15] |
| 10. | Pentaacetyl Quercetin (C23H18O11) |
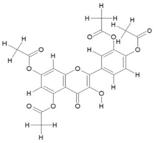 |
200 | [15] |
| 11. | Quercetin USP (CRM Standard) (C15H10O7) |
 |
0.215 | [17] |
| 12. | Quercetin-3,7,3',4'-Tetramethylether(Reagent or Standard grade) (C19H18O7) |
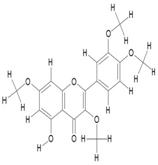 |
47.4 | [18] |
| 13. | Quercetin-3-O-B-Glucopyranoside (C12H20O12) |
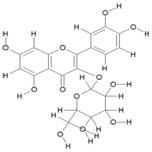 |
118.5 | [19] |
| 14. | Quercetin-3-Sophoroside (C27H13O17) |
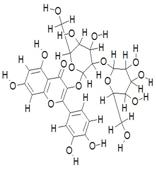 |
192 | [20] |
| 15. | Tetra(Acetylsalicyloyl) Quercetin (C51 H31O19) |
 |
200 | [15] |
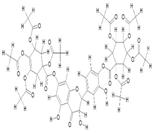
| 16. | Tri(Diacetylcaffeoyl) Quercetin (C54H40O22) |
 |
35.4 | [16] |
| 17. | Tri(Monochloropivaloyl) Quercetin (C31H35Cl3O10) |
 |
200 | [15] |
| 18. | Tri(Trimethylgalloyl) Quercetin (C45H44O19) |
 |
200 | [15] |
Hence, a study was planned to evaluate the interaction of the selected ligand with a target protein of lung cancer [6]. The increment in the speed and efficiency of drug discovery has seen huge investments by major pharmaceutical companies, which is the primary aim of reducing cost per synthesized compound or assay. Computational models were able to predict the biological activities of compounds by their structural properties which are powerful tools to design highly active molecules. Quantitative structure-activity relationship (QSAR) studies have been successfully applied for modelling biological activities of natural and synthetic chemicals [7]. The current study involves the development of 3D-QSAR models to predict the inhibitory activity of a set of 18 flavonoids. Non-Small Cell Lung Cancer EGFR plays a key role in cell signal transduction, it is an oncogene causing cancer through over expression of EGFR ligands, amplification of EGFR, and the prolonged activation in mutated EGFR-TK [8]. Approximately 10% of patients with NSCLC in the US and 35% in East Asia have tumour associated EGFR mutations [9].
Pharmacophore mapping is a broad strategy which includes a variety of experimental and computational approaches. This can be as different as a synthesis of the diversified molecular structures in the attempt to measure chemical, physical and biological characteristics and to describe structure–activity relationships (SAR) and further computational analysis of this data [10].
Therefore, discovering three-dimensional pharmacophores which can explain the activity of a series of ligands is one of the most significant contributions of computational chemistry to drug discovery [11]. Phase is a pharmacophore modeling package. It follows a hypothesis generation step, with a grid-based 3D QSAR method, in which the grid positions of atoms in molecules overlaid to the hypotheses are correlated to their activities using a partial-least-squares (PLS) fitting approach [12].
It is our aim to develop a model which depicts the crucial structural features responsible for anti-lung cancer activities. The models developed for the receptor have been analyzed to identify potential areas of selectivity in the hyperspace of 3D pharmacophores that may lead to the discovery of anti-lung cancer drug or such compounds which could serve as templates for the design of new molecules as potential anti lung cancer agents [13]. The current study involves the development of 3D-QSAR models to predict and interpret the inhibitory activity of a set of 18 Quercetin derivatives, reporting a QSAR model for describing these compounds by using multi regression analysis with classical and quantum chemical descriptors reported linear and nonlinear QSAR models and found that structural features related to the molecular topologies and charges are related to the inhibitory activity of the compounds.
2. MATERIALS AND METHODS
2.1. Preparation of Compound Library
The compounds of natural origin were identified from literatures. In the present study a data set of 18 compounds which have anticancer activity has been reported was used given in Table 1.
2.2. Ligand Preparation
A group of Quercetin derivatives, were taken from literature and as mentioned in Table 1. Chemsketch software was used to sketch the structures and was converted to their 3D representation by using Chemsketch 3D viewer of ACDLABS 8.0. Ligprep module of Schrodinger was used for Ligand preparation. All the 18 compounds were imported into software through project table. The entries were selected one by one and then minimized using impact with force field OPLS_2005 before preparing ligand. Then minimized compounds were selected one by one and prepared using ligprep application. LigPrep is a robust collection of tools designed to prepare high quality, all-atom 3D structures for large numbers of drug-like molecules, starting with 2D or 3D structures in SD or Maestro format [21].
List of ligands with their docking score, glide energy, hydrogen bond and their inter site distance with their active sites.
| S. No | Docked Compounds |
Dock Score |
Glide Energy (kcal/mol) |
Hydrogen Bond |
Ligand Atom |
Protein Atom |
H Bond Distance(Å) |
|---|---|---|---|---|---|---|---|
| 1. | Quercetin-3-Sophroside | -9.66 | -49.29 | 7 | O | ASN33 :H | 2.06 |
 |
|||||||
| H | ARG29: O | 2.03 | |||||
| H | ARG29: O | 1.69 | |||||
| H | ARG29: O | 2.36 | |||||
| H | GLN8: O | 2.18 | |||||
| O | LYS407: H | 2.33 | |||||
| H | GLN: O | 2.18 | |||||
| 2. | 3,3,4,5,7-Pentahydroxyflavone | -7.25 | -34.16 | 4 | H | ARG29 :O | 1.88 |
 |
|||||||
| H | HIS 409 :O | 2.04 | |||||
| H | VAL6 :O | 2.28 | |||||
| H | MET30 :O | 1.87 | |||||
| 3. | Quercetin USP (CRM Standard) | -7.20 | -34.07 | 4 | H | HIS409 :N | 2.04 |
 |
|||||||
| H | VAL6 :O | 2.23 | |||||
| H | ARG29 :O | 1.88 | |||||
| O | MET30 :O | 1.89 | |||||
| 4. | Quercetin-3-0-B-Glucopyranoside | -7.11 | -34.07 | 6 | H | ASN33 :O | 1.81 |
 |
|||||||
| O | ASN33 :H | 1.88 | |||||
| H | ARG29 :O | 1.87 | |||||
| H | ARG29 :O | 1.98 | |||||
| O | GLN8 :H | 2.49 | |||||
| H | GLY410 :O | 1.70 | |||||
| 5. | Tri(Monochloropivaloyl) Quercetin | -5.25 | -44.04 | 2 | H | ARG29 :O | 1.74 |
 |
|||||||
| O | VAL6 :H | 2.31 | |||||
| 6. | 5-Morfolinhydroxyproxy Quercetin | -5.25 | -45.97 | 3 | H | ARG29 :O | 1.88 |
 |
|||||||
| H | ARG29 :O | 1.71 | |||||
| H | LYS4 :O | 2.13 | |||||
| 7. | Chloronaptoquinone Quercetin | -5.00 | -42.01 | 5 | H | VAL6 : O | 2.10 |
 |
|||||||
| H | GLY410 :O | 2.12 | |||||
| H | ARG29 :O | 2.32 | |||||
| O | ARG29 :H | 2.12 | |||||
| O | LYS463 : H | 2.07 | |||||
| 8. | Di(Tetracetylquinolyl) Quercetin | -4.01 | -61.24 | 5 | O | ARG29 :H | 2.01 |
 |
|||||||
| H | ARG29: O | 2.28 | |||||
| O | LYS5 : H | 1.97 | |||||
| O | VAL6 :H | 2.49 | |||||
| H | VAL6 :O | 1.76 | |||||
| 9. | Tetra(Acetylsalicyloyl) Quercetin | -4.4969 | -74.50 | 3 | O | TYR275 :O | 2.19 |
 |
|||||||
| H | LYS5 :H | 2.07 | |||||
| O | ASN33 :H | 2.30 | |||||
| 10. | Monoacetylferuloyl Quercetin | -4.30 | -74.45 | 3 | GLU3 :O | 1.58 | |
 |
|||||||
| H | GLU60 :O | 2.01 | |||||
| H | LYS4 : H | 2.02 | |||||
| O | |||||||
| 11. | Diquercetin | -4.16 | -45.71 | 4 | H | GLU3 :O | 2.12 |
 |
|||||||
| O | ASN33 :H | 2.10 | |||||
| H | MET30 :O | 2.21 | |||||
| H | ARG29 :O | 1.78 | |||||
| 12. | Monochloropivaloyl Quercetin | -3.10 | -39.56 | 4 | O | GLN8 :H | 2.10 |
 |
|||||||
| H | ARG29 :O | 2.17 | |||||
| H | GLY410 :O | 2.00 | |||||
| H | ASN33 :O | 1.99 | |||||
| 13. | Pentaacetyl Quercetin | -3.10 | -39.56 | 2 | O | VAL6 : H | 2.07 |
 |
|||||||
| H | VAL6 :O | 1.71 | |||||
| O | ASN33 :H | 2.04 | |||||
| 14. | Monoacetyl-Di(Diacetylcaffeoyl) Quercetin | -2.89 | -50.89 | 3 | O | ARG29 :H | 2.12 |
 |
|||||||
| H | LYS4 :O | 2.48 | |||||
| H | ASN33 :H | 2.30 | |||||
| 15. | Tri(Trimethylgalloyl) Quercetin | -2.13 | -35.74 | 2 | O | LYS5 :H | 1.99 |
 |
|||||||
| O | LYS5 :H | 2.22 | |||||
| 16. | Tri(Diacetylcaffeoyl) Quercetin | -2.01 | -38.60 | 1 | VAL6 :H | 2.05 | |
 |
|||||||
| O | LYS5 :H | ||||||
| 17. | Quercetin-3-7,3,4 Tetramethylether(Reagent or Standard grade) | -1.68 | -34.40 | 3 | H | ARG29 :O | 1.83 |
 |
|||||||
| O | GLN8 :H | 2.00 | |||||
| O | VAL6 :H | 2.26 | |||||
| 18. | Di(Diacethylcaffeoyl)- Mono(Monoacetylcaffeoyl) Quercetin | 0.09 | -52.82 | 2 | O | GLN59 :H | 2.02 |
 |
|||||||
| O | GLN8 :H | 2.16 | |||||
| 19. | Quercetin | -5.43 | -33.38 | 4 | H | ASN33 : O | 1.85 |
 |
|||||||
| O | ASN33 :H | 1.96 | |||||
| H | ARG29 :O | 1.85 | |||||
| O | GLN8 :H | 1.87 |
2.3. Protein Preparation
The x-ray crystallography structure of EGFR protein of NSCLC was retrieved from PDB (ID: 1MOX). In order to be used as a receptor for docking, protein structures should be processed. Schrodinger Suite automates this work, and the necessary preparation can be carried out by launching the Protein Preparation Wizard from the Workflows menu. Protein is selected in the project table. Hit preprocess. From the preprocess result, one chain is restored and other chains are deleted, water molecules and ligands present. The refinement compound performs a restrained impact minimization and impact optimization of the crystallized compound which reorients side chain hydroxyl groups and alleviates potential steric clashes [21]. The protein was optimized with OPLS 2005 force field and then minimization is done under the criteria of after 5000 steps or after the energy gradient converged below 0.5Kcal/mol.
2.4. Receptor Grid Generation
Grid files represent physical properties of a volume of the receptor (specifically the active site) that are searched when attempting to dock a ligand. The shape and properties of the receptor are represented on a grid by several different sets of fields that provide progressively more accurate scoring of ligand poses. The active sites of EGFR protein were obtained from PDBsum. They are Lys5(A), Asn32(A), Asn33(A) and Gln28(A). All these active sites are selected for the generation of the grid which can be done under ‘Receptor grid Generation’ of Glide.
2.5. Ligand Docking
The ligands were docked initially using the “standard precision” methods and further refined using “extra precision” Glide algorithm. The generated grid is taken as the receptor. The docking can be done under ‘Ligand Docking’ of Glide. Here we use Flexible docking, where the ligand is kept flexible and the energy for different conformations of the ligand fitting into the protein is calculated. It was done successfully and docking scores were obtained for all docked ligands. OPLS_2005 force field was used for this work. Selection of the final docked pose is accomplished using a glide score, which is model empirical function that combines empirical and force field based terms Table 2.
Pharmacophore generated hypothesis with their R2 value.
| Hypothesis | R2 Test Set |
R2 Training Set |
Hypothesis | R2 Test Set |
R2 Training Set |
|---|---|---|---|---|---|
| AAARR1016 | 0.95 | 0.31 | AAARR1386 | 0.76 | 0.86 |
| AAARR1039 | 0.92 | 0.51 | AAARR1657 | 0.67 | 0.39 |
| AAARR.1145 | 1.00 | 0.98 | AAARR1880 | 0.76 | 0.83 |
| AAARR1253 | 1.36 | 0.69 | AAARR1938 | 0.11 | 0.60 |
| AAARR.1392 | 0.05 | 0.40 | AAARR1984 | 0.76 | 0.68 |
| AAARR2894 | 0.17 | 0.63 | AAARR1991 | 0.48 | 0.64 |
| AAARR3277 | 0.52 | 0.62 | AAARR2954 | 0.80 | 0.82 |
| AAARR3486 | 0.12 | 0.68 | AAARR.2945 | 0.81 | 0.64 |
| AAARR3933 | 0.28 | 0.67 | AAARR3195 | 0.46 | 0.49 |
| AAARR3848 | 0.21 | 0.53 | AAARR3245 | 0.40 | 0.78 |
| AAARR4725 | 0.44 | 0.69 | AAARR3247 | 0.47 | 0.59 |
| AAARR6353 | 0.71 | 0.6 | AAARR3251 | 0.05 | 0.43 |
| AAARR6445 | 0.00 | 0.42 | AAARR3306 | 0.96 | 0.74 |
| AAARR175 | 0.72 | 0.61 | AAARR3330 | 0.31 | 0.54 |
| AAARR268 | 0.63 | 0.76 | AAARR3471 | 0.08 | 0.23 |
| AAARR.556 | 0.21 | 0.55 | AAARR3521 | 0.94 | 0.79 |
| AAARR1052 | 0.15 | 0.58 | AAARR3533 | 0.64 | 0.81 |
| AAARR1100 | 0.20 | 0.55 | AAARR4009 | 0.48 | 0.955 |
| AAARR1181 | 0.74 | 0.64 | AAARR4584 | 0.30 | 0.20 |
| AAARR1193 | 0.91 | 0.89 | AAARR4690 | 0.32 | 0.75 |
| AAARR1234 | 0.39 | 0.72 | AAARR4471 | 0.77 | 0.69 |
| AAARR1242 | 0.69 | 0.72 | AAARR6364 | 0.93 | 0.72 |
| AAARR1294 | 0.13 | 0.75 | AAARR6413 | 0.98 | 0.66 |
| AAARR1302 | 0.18 | 0.75 | AAARR6783 | 0.40 | 0.51 |
| AAARR1357 | 0.86 | 0.68 | AAARR6872 | 0.70 | 0.55 |
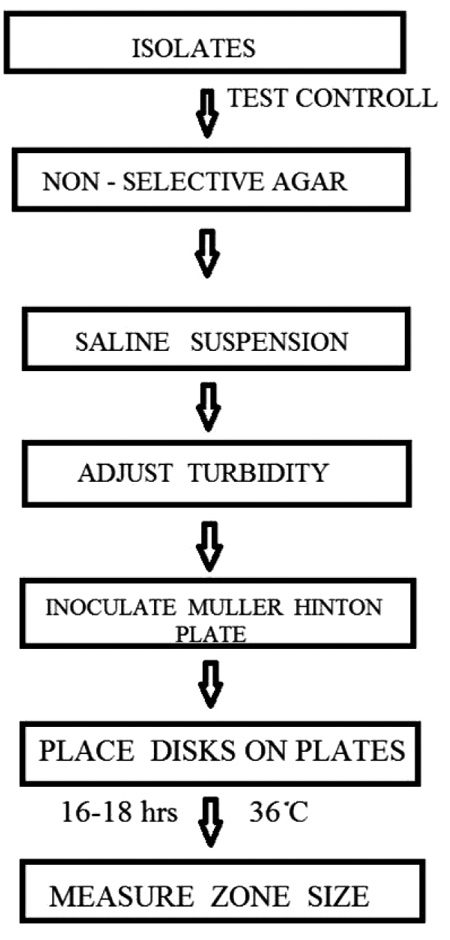
 |
Fig. (1). Summary description of phase methodology [12]. |
2.6. 3D QSAR Study
In order to predict the Quantitative structure activity relationships between the activation of flavonoids derivatives and to derive a predictive model, activity values are analyzed using 3D QSAR. Given a set of molecules with high affinity for a particular protein target, Phase uses fine-grained conformational sampling and a range of scoring techniques to identify common pharmacophore hypothesis, which convey characteristics of 3D chemical structures that are critical for binding. Each hypothesis is accompanied by a set of aligned conformations that suggest the relative manner in which the molecules are likely to bind. The aim of QSAR study will be to derive a correlation between the biological activity of a set of molecules and their pharmacophore based descriptor [22]. This correlation will be derived from a series of superimposed conformations, one for each molecule in the set [21].
2.6.1. Pharmacophore Descriptors:
- Number of acidic atoms
- Number of basic atoms
- Number of hydrogen bond donor atoms
- Number of hydrophobic atoms
- Sum of VDW surface areas of hydrophobic atoms
In order to investigate the quantitative relationships between the activities of Quercetin derivatives and to derive a predictive model that will be useful in future, the activity values were analyzed using a 3D QSAR strategy. Discovering three – dimensional pharmacophores that can explain the activity of a ligands is one of the most significant contributions of computational chemistry to drug discovery, and Phase is one of the most recently developed pharmacophore tools. Phase has a hypothesis generating step based on a grid-based 3D QSAR method in which the grid positions of the atoms in the molecules superimposed on the hypothesis are correlated with their activities using a partial least square (PLS) fitting. The main stage of hypothesis are summarized in Fig. (1) [12].
Methods for QSAR studies.
| S.No | Method | Test Set | Training Set |
|---|---|---|---|
| 1. | Regression coefficient | 0.76 | 0.86 |
| 2. | Cross validation regression coefficient | 0.49 | 0.84 |
| 3. | Variance | 18232 | 21732.5 |
| 4. | Standard deviation | 135.02 | 147.42 |
2.7. Scoring Function
A systematic search was performed to determine significant descriptors. Some of the descriptors were rejected because they contained a value of zero for all the compounds. In order to minimize the effect of colinearity and to avoid redundancy correlation matrix developed with a cut off value of 0.6 and the variables physically removed from the analysis which show exact linear dependencies between subsets of the variables and multi colinearity (high multiple correlations between subsets of the variables). From descriptors thus remained, the set of descriptors that would give the statistically best QSAR models were selected from the large pool using a Genetic function approach. The genetic algorithm starts with the creation of a population of randomly generated parameter sets. The usage probability of a given parameter from active set is 0.5 in any of the initial population sets. The sets are then compared according to their objective functions. The form of objective function favors sets that have the r2 as high as possible, while minimizing the number of parameters used as descriptors. The higher the score the higher the probability of a given set will be used for the creation of the next generation of sets. Creation of a consecutive generation involves crossovers between set contents, as well as mutations. The parameters set used for genetic algorithm includes: mutation 0.1, crossover 0.9, population 300, number of generations 1000, R2 floor limit 50% and objective function was R2/N_par. The algorithm runs until the desired number of generations is reached. Equations were developed between the observed activity and the descriptors. The best equation was taken based on the statistical parameters such as regression coefficient (r2), adjusted regression coefficient (r2adj), regression coefficient cross validation and F-test values.
3. RESULTS AND DISCUSSION
3.1. Docking Study of the Compounds
The docking scores and energy values obtained are tabulated for each entry of XP result.
The docking score were obtained for most of the compound which varies from between -9.66 to 7.11. Monochloropivaloyl Quercetin, Pent acetyl Quercetin, Monoacetyl Di(Diacetylcaffeoyl) Quercetin,Tri(Trimethylgalloyl Quercetin, Tri(Diacetylcaffeoyl) Quercetin, Quercetin-3-7,3,4 Tetramethylether(Reagent or Standard grade), Di(Diacethylcaffeoyl) Mono (Monoacetylcaffeoyl) Quercetin. shows low docking score but the docking energy of the compounds except Di(Diacethylcaffeoyl)-Mono (Monoacetylcaffeoyl ) is good. Obtained docking score of Quercetin derivatives by using flexible ligand docking are equivalent to [23].
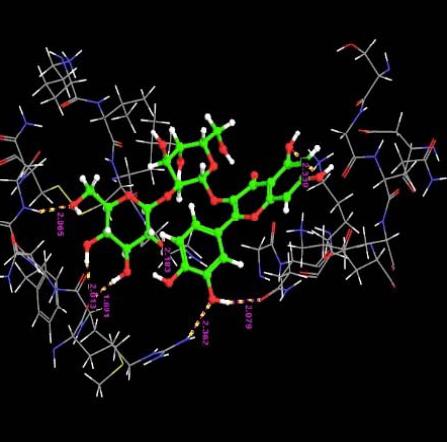
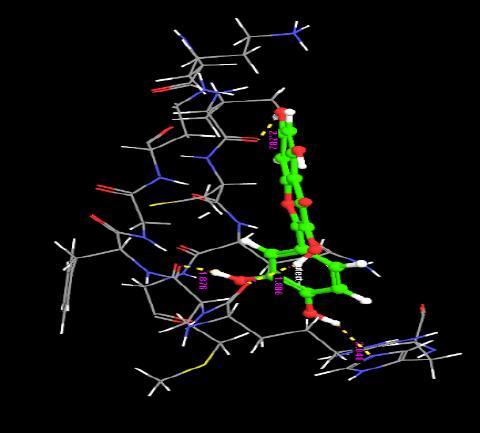
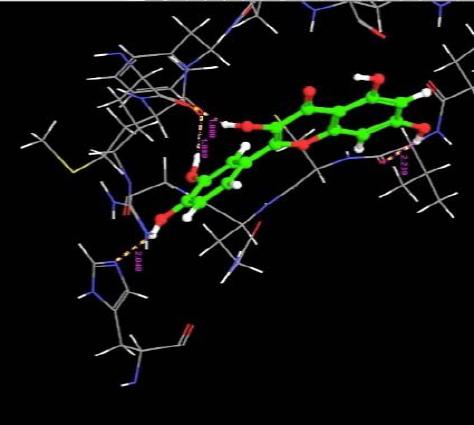
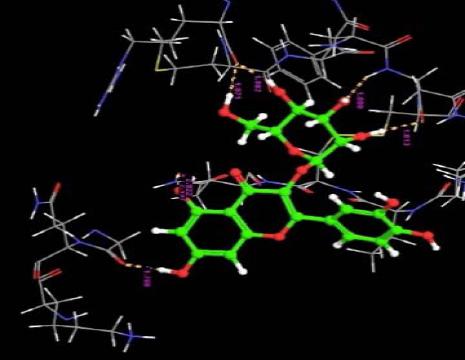
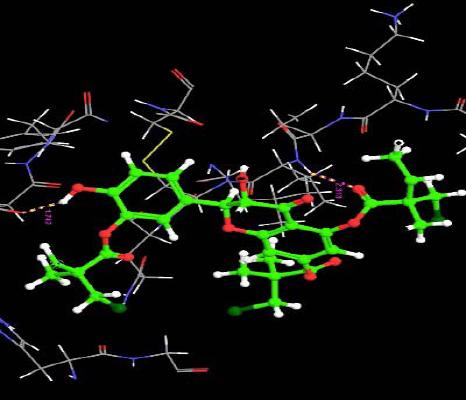
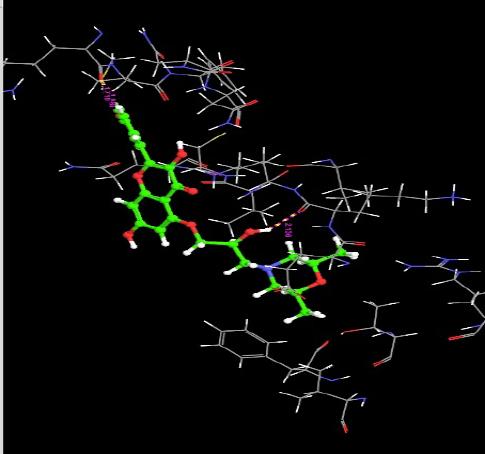
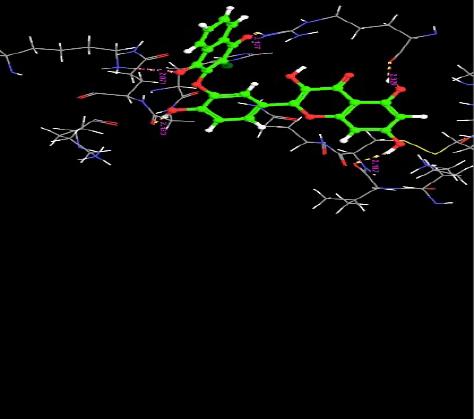
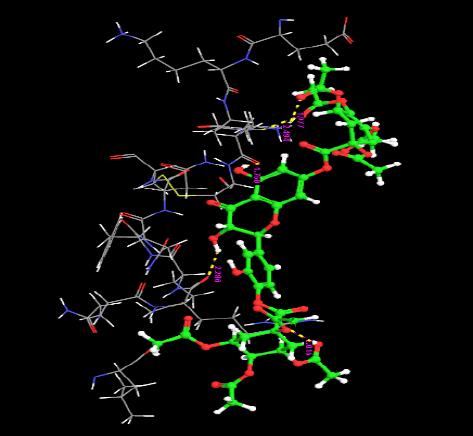
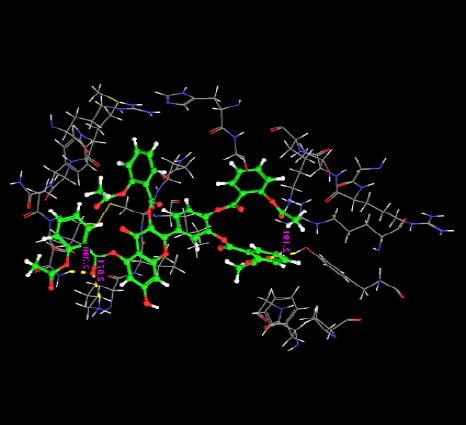
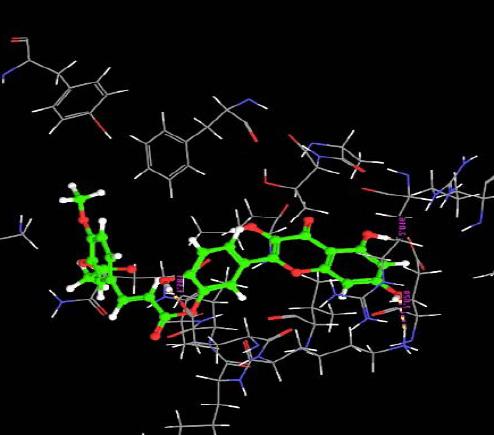
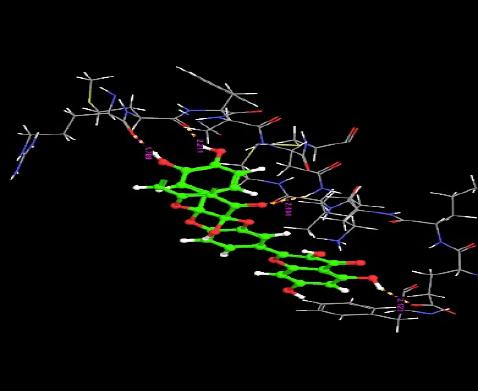
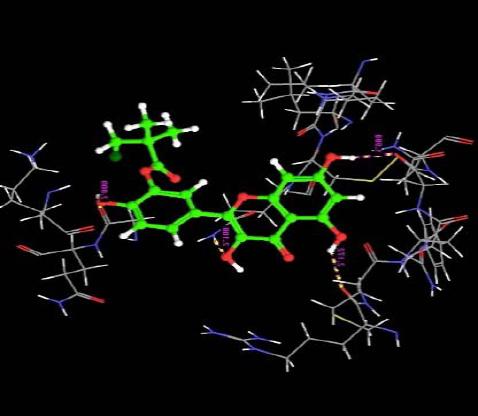
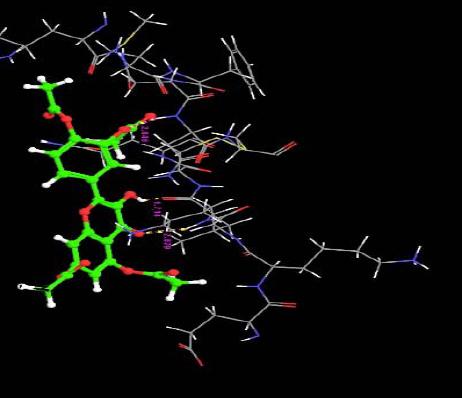
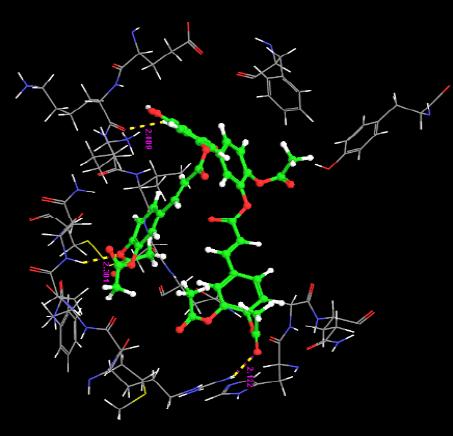
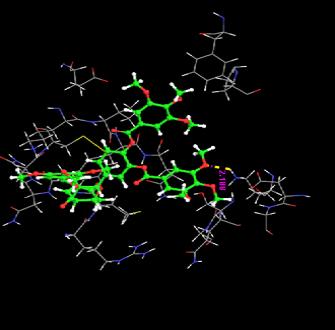
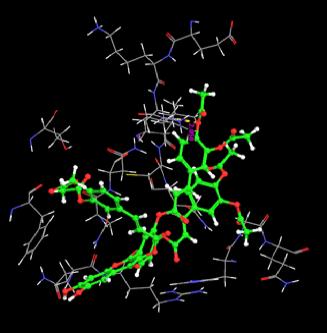
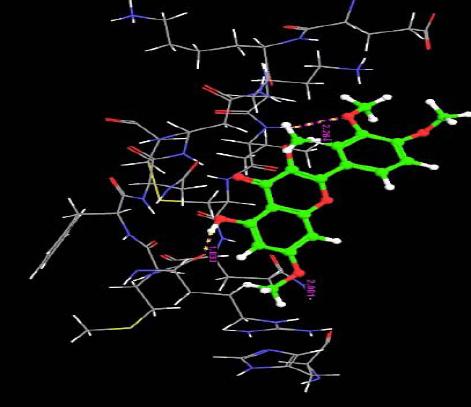
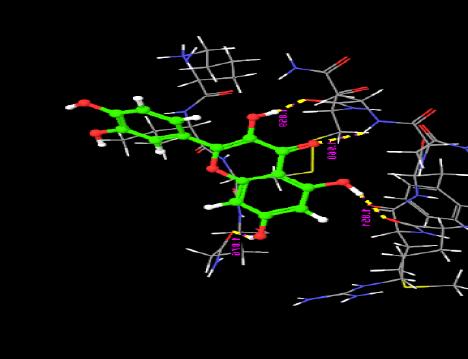
The interaction of the ligands with the active sites of the protein is illustrated through the hydrogen bonds formed between them. The presence of hydrogen bonds confirm the strength of the interaction between the ligands and the protein.
List of experimental and predicted activity values of compounds in the training set along with individual fitness score with respect to the best hypothesis AAARR.1386.
| S.No | Derivatives | Expt. IC50 (µm) |
Pred. IC50 (µm) |
Fitness |
|---|---|---|---|---|
| 1. | Quercetin-3-Sophroside | 192 | 177.48 | 2.17 |
| 2. | Quercetin USP | 0.21 | 135.41 | 2.49 |
| 3. | Tri(Monochloropivaloyl) Quercetin | 200 | 176.31 | 1.93 |
| 4. | Di(Tetracetylquinolyl) Quercetin | 63.7 | 49.03 | 1.83 |
| 5. | Tetra(Acetylsalicyloyl) Quercetin | 200 | 182.27 | 1.74 |
| 6. | Monochloropivaloyl Quercetin | 270.2 | 178.37 | 2.29 |
| 7. | Pentaacetyl Quercetin | 200 | 161.41 | 2.18 |
| 8. | Monoacetyl-Di(Diacetylcaffeoyl) Quercetin | 29.2 | 64.62 | 1.91 |
| 9. | Tri(Diacetylcaffeoyl) Quercetin | 35.4 | -20.19 | 1.25 |
| 10. | Quercetin-3-7,3,4 Tetramethylether (Reagent or Standard grade) | 47.4 | 119.39 | 2.24 |
| 11. | Di(Diacethylcaffeoyl)-Mono(Monoacetylcaffeoyl) Quercetin | 200 | 214.02 | 2.21 |
Almost all the ligands show hydrogen bond interaction with the protein. The number of hydrogen bond ranges from 7 to 1. The highest number of hydrogen bonds is being shown by Quercetin-3-Sophroside and Quercetin-3-0-B-Glucopyranoside whereas Di(Diacethylcaffeoyl) Mono (Monoacetylcaffeoyl) Quercetin, Tri (Diacetylcaffeoyl) Quercetin, Tri(Trimethylgalloyl Quercetin and Tri (Monochloropivaloyl) Quercetin shows less interaction. Hence we have similar interactions as compared to [23].
List of experimental and predicted activity values of compounds in the test set along with individual fitness score with respect to the best hypothesis ADDRR.1386.
| S.No | Analogue | Expt. IC50 (µm) | Pred. IC50 (µm) | Fitness |
|---|---|---|---|---|
| 1. | 3,3,4,5,7-Pentahydroxyflavone | 8.9 | 141.02 | 2.39 |
| 2. | Quercetin-3-0-B-Glucopyranoside | 118.5 | 131.73 | 2.02 |
| 3. | 5-Morfolinohydroxyproxy Quercetin | 200 | 135.83 | 3 |
| 4. | Chloronaptoquinone Quercetin | 28.4 | 130.77 | 2.21 |
| 5. | Monoacetylferuloyl Quercetin | 200 | 95.08 | 1.92 |
| 6. | DiQuercetin | 58.8 | 154.89 | 1.90 |
| 7. | Tri(Trimethylgalloyl) Quercetin | 200 | 147.68 | 1.73 |
3.2. Pharmacophore Model Generation
Pharmacophore model generation was done for all the 18 Quercetin derivatives were docked to the protein site and taken for the receptor mapping. The activity threshold is assigned as above 11 active molecules and below 7 inactive molecule. Thus after defining the variant list as 5 and minimum number of 4 ligands that should match out of 12 active ligands, 50 hypothesis were generated (Table 3) out of which the hypothesis with R2 value above 0.5.
Reliable predictions can only come from statistically valid QSAR model. There are several statistical parameters, such as leaven –out cross validation for training set (R2), leaven-out validation for test set (Q2), standard deviation (SD), root mean square error (RMSE), and variance ratio (F) that can be used to evaluate the robustness of a QSAR model (Table 4). The Q2 value of all the hypothesis are greater than 0.55, F-test values are very high. High is necessary, the best QSAR model should be chosen based on its predictive ability, so the best model should have high Q2 value also [24].
The pharmacophore models generated consisted of 5 features namely hydrogen bond acceptors and aromatic rings. Though the pharmacophore features are the same, the 3D spatial arrangements of the pharmacophoric features were found to be different. QSAR models have been built for all 18 compounds to identify the better pharmacophore model among the obtained sets.
For each hypothesis generated, the active molecules were scored, number of sites matched and identified the match that gives the highest fitness score and their 3D QSAR models were built. The predicted activities for each ligand with respective hypothesis were obtained and for each hypothesis the ligands have been divided into training set and test set. Regression coefficient (R2) value is calculated between experimental activity and predicted activity for both training set and test set ligands. The hypothesis AAARR.1386 is taken as the best hypothesis. The experimental activity, predicted activity and fitness for both training (Table 5) and test set (Table 6) are summarized which was based on [23].
3.3. Validation of QSAR Prediction Model
The predictive capability of the QSAR equation was determined using leave-one out cross validation model. The cross validation regression coefficient (q2 cv) was calculated by the following equation.
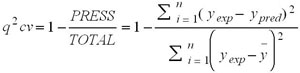
Where, ypred, yexp, ȳ and are the predicted, experimental and the mean values of experimental activity, respectively. Also the accuracy of the prediction of the QSAR equation was validated by F-value, r2 and radj2. A large F indicates that the model fit is not a chance occurrence. It has been shown that a high value of statistical characteristics is not necessary for the proof of a highly predictive model [24]. Hence, in order to evaluate the predictive ability of our QSAR model the values of the of the correlation coefficient of predicted and actual activities and the correlation coefficient for regressions through the origin (predicted vs. actual activities and vice versa) were calculated and a score value of 0.76 for the test set and a score value of 0.86 for the training set were obtained, which is similar to [23].
The data points would need to be on the R2 line for a R2 value of 1.0. The graphical representation of the activity values and their correlation relationship between predicted and experimental activities as per Pharmacophore generation of the training set compounds as well as test set compounds are shown in Fig. (2) and Fig. (3), which has given similar predicted versus actual activity values for the training set of the Phase model as [23].
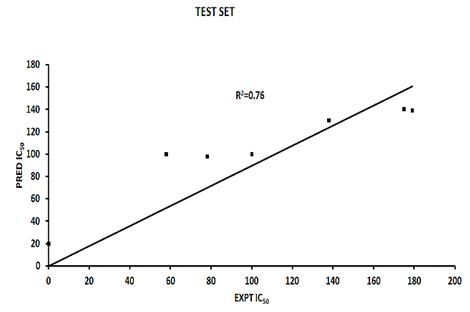 |
Fig. (2). Predicted versus actual activity values for the test set of the phase model with the highest R2 value. |
The orientation of the Quercetin derivatives into the protein receptor site is given by the bond distance Fig. (4) having a range of 7.99 to 2.77 and a bond angle Fig. (5) of 69.2 to 11.3 which can be taken as a comparison to a work done by [23].
 |
Fig. (3). Predicted versus actual activity values for the training set of the phase model with the highest R2 value. |
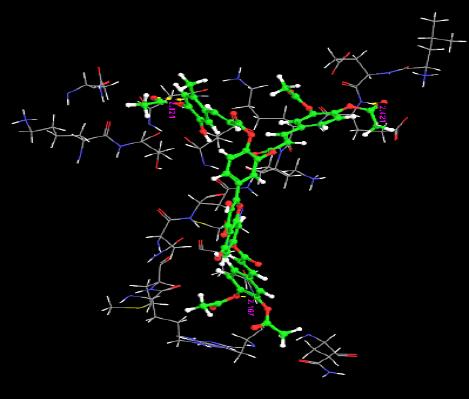
All other ligands have shown good superimposition with the reference ligand, except for Quercetin-3-Sophroside, 5-Morfolinhydroxyproxy Quercetin, Di(Tetracetylquinolyl) Quercetin, Tetra(Acetylsalicyloyl) Quercetin, Monoacetylferuloyl Quercetin, Monoacetyl-Di(Diacetylcaffeoyl) Quercetin, Tri(Trimethylgalloyl) Quercetin, Tri(Diacetylcaffeoyl) Quercetin, Quercetin-3-7,3,4 Tetramethylether(Reagent or Standard grade)Di(Diacethylcaffeoyl)-Mono(Monoacetylcaffeoyl) Quercetin in Fig. (6).
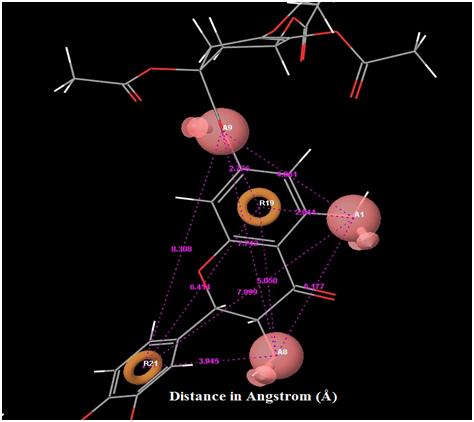 |
Fig. (4). Distance between each pharmacophore features in the best hypothesis AAARR.1386. Orange: aromatic ring, pink: hydrogen bond acceptor. |
In Fig. (7) blue cube indicate favorable regions while red cube indicates unfavorable regions for activity, the representation of the 3D QSAR models [25]. In these types of figures, the cubes that represent the model are displayed and colored according to sign of their coefficient values where blue indicates positive and red indicates negative coefficient respectively, and indicate regions that increase or decrease the analyzed parameter. One of the advantages of using these representations is that the position of the cubes in the 3D-QSAR model can be compared with the positions of the amino acid residues in the active sites. This might provide insight into which functional groups are desirable or undesirable at certain positions of a molecule [26].
Most of the ligand molecules were shown to have good fitness value for the hypothesis with highest value generated AAARR.1386. The hypothesis had a regression coefficient of 0.76 for test set and 0.86 for the training set, after the Predicted and Experimental IC50 values and their correlation were graphically depicted. All these ligand molecules have been overlaid along with the best fitness ligand molecule as shown in Fig. (6). When all the ligand are aligned into the pharmacophore model hydrogen bond acceptor, aromatic rings and hydrogen bond donors are recognized as favorable regions. From the best Phase hypothesis the functional features were identified as 3 hydrogen bond acceptors and 2 aromatic rings. Therefore the results obtained from this pharmacophore model is equivalent to the work done by [23].
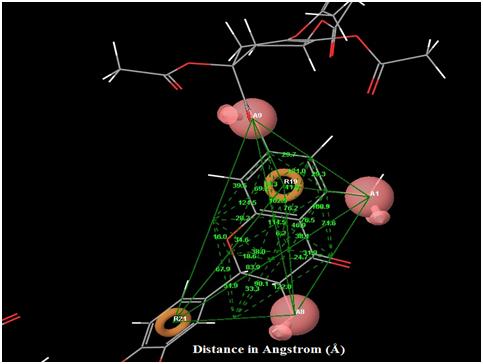 |
Fig. (5). Angles between each pharmacophore features in the best hypothesis AAARR.1386. |
CONCLUSION
This project was aimed for pharmacophore mapping of NSCLC cells by focusing on finding the structure of the receptor. The compounds were of natural origin, which are known to act on the NSCLC protein and obtained from literatures. Then their interaction with EGFR was studied to find one of the best potential targets. Hence, we have shown a pharmacophore based 3D QSAR study of Quercetin derivatives that are aimed at inhibiting EGFR protein. Most of the molecules proved to be effective in terms of their binding score, the best score being -9.66028 and the binding energy value -74.45. From the 50 hypothesis obtained from Phase methodology, a robust pharmacophore model was developed statistically, the best hypothesis was obtained by calculating the regression coefficient (R2) for each of them taking into consideration their Experimental and Predicted IC50 values and also taking into account their fitness and validated using statistical calculations. The R2 value for both the training and test sets were significant for the hypothesis AAARR.1386. This pharmacophore was identified to have 5 pharmacophore features namely 3 hydrogen bond acceptors and 2 aromatic rings. Thus, such a pharmacophore model provides insights into the structural and chemical features of the EGFR inhibitors of Quercetin derivatives and validates the result that these compounds can be used for effective inhibitors of NSCLC cells and the features of the receptor, obtained from the pharmacophore model can be used in further studies.
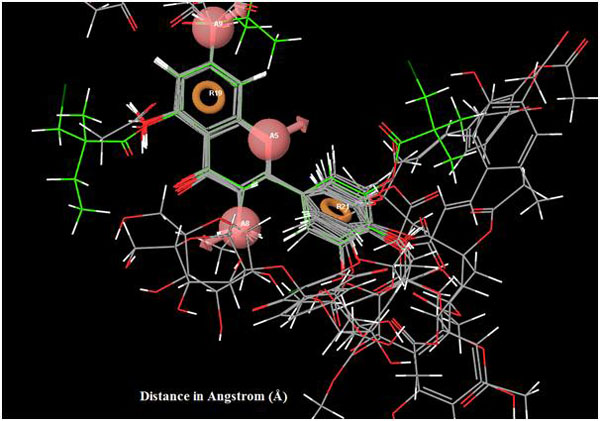 |
Fig. (6). Superimposition of reference ligand with other ligands having good fitness. |
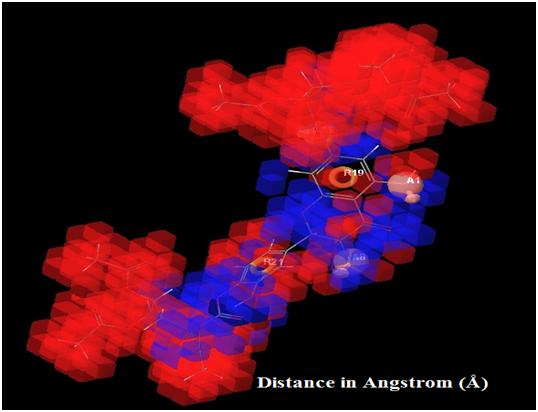 |
Fig. (7). Showing high and low activity regions in the respective pharmacophore features and QSAR visualized by different color pattern, orange: aromatic ring; pink: hydrogen bond acceptor. |
LIST OF ABBREVIATIONS
CONFLICT OF INTEREST
The authors confirm that this article content has no conflict of interest.
ACKNOWLEDGEMENTS
Authors are thankful to Dr. J Jannet Vennila, The Director of School of Biotechnology Health Sciences, Karunya University for providing very nice working atmosphere and resources.
REFERENCES
| [1] | Center M, Siegel R, Jemal A. Global cancer facts & figures. Atlanta: American Cancer Society 2011; pp. 1-52. |
| [2] | Thun MJ, Lally CA, Calle EE, Heath CW, Flannery JT, Flanders WD. Cigarette smoking and changes in the histopathology of lung cancer. J Natl Cancer Ins 1997; 89(21): 1580-86. |
| [3] | Molina JR, Yang P, Cassivi SD, Schild SE, Adjei AA. Non-small cell lung cancer: epidemiology, risk factors, treatment, and survivorship. Mayo Clin Proc 2008; 83(5): 584-94. |
| [4] | Noureen N, Kalsoom S, Rashid H. Ligand based pharmacophore modelling of anticancer histone deacetylase inhibitors. Afr J Biotechnol 2010; 9(25): 3923-31. |
| [5] | Guner OF. Pharmacophore perception, development, and use in drug design. La Jolla, CA: International University Line 2000; p. 29. |
| [6] | Mukund S, Muthukumaran M, Sivasubramanian V. In-Silico drug designing from flavonoids derivatives of Oscillatoria terebriformis against lung cancer protein inhibitor. Int J Pharm Res Dev 2014; 6(8): 26-31. |
| [7] | Fatima ZT, Menana H. 3D-QSAR study of novel tyrosine inhibitory aganist matrix metalloproteinase and histone deacetylase. Int J Adv Res Comp Sci Software Eng 2015; 5(1): 135-40. |
| [8] | Zhang Z, Stiegler AL, Boggon TJ, Kobayashi S, Halmos B. EGFR-mutated lung cancer: a paradigm of molecular oncology. Oncotarget 2010; 1(7): 497-514. |
| [9] | Lovly C, Horn L, Pao W. EGFR in Non-Small Cell Lung Cancer (NSCLC). My Cancer Genome 2015. Available from: https://www.mycancergenome.org/content/disease/lung-cancer/egfr/. 2015. |
| [10] | Polanski J. Self-organizing neural networks for pharmacophore mapping. Adv Drug Deliv Rev 2003; 55(9): 1149-62. |
| [11] | Bhole RP, Bhusari KP. Docking studies of some new derivatives of P-Hydroxybenzohydrazide as an antihypertensive agent. Dig J Nanomater Biostruct 2010; 5(1): 233-9. |
| [12] | Evans DA, Doman TN, Thorner DA, Bodkin MJ. 3D QSAR methods: Phase and Catalyst compared. J Chem Inf Model 2007; 47(3): 1248-57. |
| [13] | Debnath S, De UC, Sen D, Dinda B. Pharmacophore Modeling and 3D QSAR analysis of flavonoids and congeners active against A549 cell line. Int J Res Pharm 2012; 3(2): 206-14. |
| [14] | Ogunbayo OA, Harris RM, Waring RH, Kirk CJ, Michelangeli F. Inhibition of the sarcoplasmic/endoplasmic reticulum Ca2+-ATPase by flavonoids: A quantitative structure-activity relationship study. IUBMB Life 2008; 1; 60(12): 853-58. |
| [15] | Danihelová M, Veverka M, Sturdík E, Jantová S. Antioxidant action and cytotoxicity on HeLa and NIH-3T3 cells of new quercetin derivatives. Interdiscip Toxicol 2013; 6(4): 209-16. |
| [16] | Kruzlicova D, Danihelova M, Veverka M. Quantitative structure-antioxidant activity relationship of quercetin and its new synthetised derivatives. Nova Biotechnol Chim 2012; 11(1): 37-44. |
| [17] | Vicentini FT, Casagrande R, Georgetti SR, Bentley MV, Fonseca MJ. Influence of vehicle on antioxidant activity of quercetin: a liquid crystalline formulation. Latin Am J Pharma 2007; 26(6): 805. |
| [18] | Guerrero MF, Puebla P, Carrón R, Martín ML, San Román L. Quercetin 3,7-dimethyl ether: a vasorelaxant flavonoid isolated from Croton schiedeanus Schlecht. J Pharm Pharmacol 2002; 54(10): 1373-8. |
| [19] | Shokoohinia Y, Rashidi M, Hosseinzadeh L, Jelodarian Z. Quercetin-3-O-β-D-glucopyranoside, a dietary flavonoid, protects PC12 cells from H2O2-induced cytotoxicity through inhibition of reactive oxygen species. Food Chem 2015; 167: 162-7. |
| [20] | Watson RR, Preedy VR, Zibadi S. Polyphenols in human health and disease. London: Academic Press 2013; pp. 257-8. |
| [21] | Schrödinger LL. Maestro, version 9.0. Schrödinger New York, NY, USA. 2009. |
| [22] | Amitha J, Alam A. Quantitative structure activity relationship (QSAR) of cardiac glycosides: the development of predictive in vitro cytotoxic activity model. Pharma Lett 2012; 4(4): 1246-69. |
| [23] | Alam A, Veni NC, George L, Anurupa D, Thalitha J. Cytotoxicity activity model of hydroxamic acid analogues as histone deacetylase (hdac) inhibitors based on docking and pharmacophore 3D QSAR approach. Asian J Pharm Health Sci 2012; 2(2): 320-7. |
| [24] | Naik PK, Dubey A, Kumar R. Development of predictive quantitative structure-activity relationship models of epipodophyllotoxin derivatives. J Biomol Screen 2010; 15(10): 1194-203. |
| [25] | Dhanachandra SK, Karthikeyan M, Kirubakaran P, Nagamani S. Pharmacophore filtering and 3D-QSAR in the discovery of new JAK2 inhibitors. J Mol Graph Model 2011; 30: 186-97. |
| [26] | Guasch L, Sala E, Valls C, et al. Structural insights for the design of new PPARgamma partial agonists with high binding affinity and low transactivation activity. J Comput Aided Mol Des 2011; 25(8): 717-28. |