RESEARCH ARTICLE
Signal Detection and their Assessment in Pharmacovigilance
Anoop Kumar1, *, Henna Khan2
Article Information
Identifiers and Pagination:
Year: 2015Volume: 2
First Page: 66
Last Page: 73
Publisher Id: PHARMSCI-2-66
DOI: 10.2174/1874844901502010066
Article History:
Received Date: 6/2/2015Revision Received Date: 11/6/2015
Acceptance Date: 27/10/2015
Electronic publication date: 17/12/2015
Collection year: 2015
open-access license: This is an open access article licensed under the terms of the (https://creativecommons.org/licenses/by/4.0/legalcode), which permits unrestricted, noncommercial use, distribution and reproduction in any medium, provided the work is properly cited.
Abstract
Signal detection and its assessment is the most important aspect in pharmacovigilance which plays a key role in ensuring that patients receive safe drugs. For detection of adverse drug reactions, clinical trials usually provide limited information as they are conducted under strictly controlled conditions. Some of the adverse drug reactions can be detected only after long term use in larger population and in specific patient groups due to specific concomitant medications or disease. The detection of unknown and unexpected safety signals as early as possible from post marketing data is one of the major challenge of pharmacovigilance. The current method of detecting a signal is predominantly based on spontaneous reporting, which is mainly helpful in detecting type B adverse effects and unusual type A adverse effects. Other sources of signals detection are prescription event monitoring, case control surveillance and follow up studies. Signal assessment is mainly performed by using Upsala Monitoring scale & Naranjo scale of probability to analyze the cause and effect analysis. Signal detection and their assessment is very vital and complex process. Thus, the main objective of this review is to provide a summary of the most common methods of signal detection and their assessment used in pharmacovigilance to confirm the safety of a drug. Recent developments, challenges, & future needs have also been discussed.
1. INTRODUCTION
All drugs are capable of producing adverse effects and whenever a drug is given a risk is taken. The magnitude of risk has to be considered along with the magnitude of expected therapeutic benefit in deciding whether to use or not to use a particular drug in a given patient [1]. Lazarou et al., 1998 has suggested that adverse drug reactions are the fourth to the sixth commonest cause of death [2]. About 6.5% to 6.89% of all hospital admissions are due to (ADRs) which increase the duration of hospital stay and the cost incurred upon the patient [3, 4]. Patelet et al., 2007 reported that more than 50% of ADRs are definitely or potentially avoidable [5].
During the drug development process (Phase 1-Phase 3), adverse drug reactions are reported to the regulatory authorities and ethical committees in the form of drug safety update reports (DSURs). If any adverse drug reaction occurs during the trial, the principal investigator reports to the sponsor within 24hrs and to the Institutional review board (IRB) within 14 working days. Further, the sponsor reports to the regulatory authorities within 14 calendar days. Due to homogenous population sample (strict inclusion/exclusion criteria, subjects having single disease, specific groups of children, elderly and pregnant women being excluded), small sample size (detection of rare adverse effect is difficult), shorter duration of a trial (limits the detection of long term adverse effects), inability to detect ADRs under real life situations (drug interaction, drug food interactions etc.). Thus, there is an urgent need for a system which keeps an eye on the ADRs of the medicinal products [6].
Pharmacovigilance is mainly the phase 4 of drug development process and also known as post marketing surveillance. The World Health Organisation (WHO) defines Pharmacovigilance as a science related to the detection, assessment, understanding and prevention of adverse reactions towards a medicinal product or any other medicine related problems in human beings [7]. The main objective of pharmacovigilance is to quantify previously recognized adverse drug reactions, to identify unrecognized adverse drug events, to evaluate the effectiveness of medicines in real-world situations, and to decrease mortality and morbidity associated with adverse events [8, 9].
Signal detection and its assessment is the most important aspect of pharmacovigilance [10]. The WHO defines a signal as: ‘Reported information on a possible causal relationship between an adverse event and a drug, of which the relationship is unknown or incompletely documented previously’. Often, a limited number of reports represent a signal [11]. These signals are reported to regional pharmacovigilance centres followed by zonal centres. Finally, all case reports are filed in databases at the National Centres as well as sent onto the WHO Collaborating Centre for International Drug Monitoring (the Upsala Monitoring Centre) [11, 12]. Further, signal assessment is performed using Upsala Monitoring scale (UMC) & Naranjo scale of probability to analyse the cause and effect analysis. Signal detection and its assessment is very vital and complex process. Thus, in this review, we have tried to compile the qualitative methods of signal detection and its assessment used in pharmacovigilance.
2. SIGNAL DETECTION
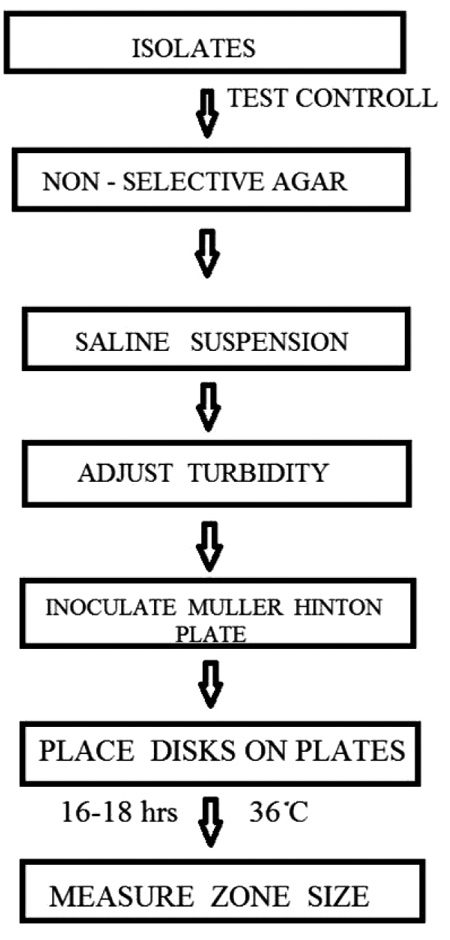
The early detection of safety signals as soon as possible is increasingly important and of great interest to the pharmaceutical industry, regulators, and the public domain [13]. Signals have both qualitative and quantitative aspects. Different categories of adverse events need different methodologies for detection. The primary function of pharmacovigilance is early detection of signals [14]. In 1960s, thalidomide tragedy occurred due to late signal detection [15]. However, spontaneous reporting systems have now been developed and used all around the world. The number of case reports received by the World Health Organization (WHOUMC) collaborating Centre for International Drug Monitoring in Uppsala, Sweden is continuously rising and now numbers almost 2,00,000 per year [10]. The safety signals are generated by various sources such as spontaneous reporting, case control and cohort studies, pre-clinical as well as clinical studies as shown in Fig. (1).
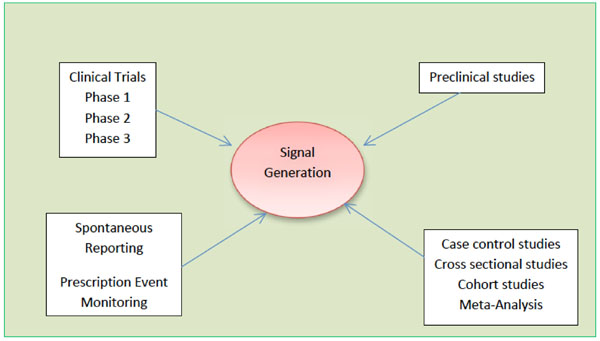 |
Fig. (1). Different sources of generation of safety signals. |
2.1. Spontaneous Reporting System
Current pharmacovigilance is predominantly based upon spontaneous reporting system (SRS). Case report and case series are generally considered as part of spontaneous reporting system. It is helpful in detecting type B effects and unusual type A effects. The main function of SRS is the early detection of signals of new, rare and serious ADRs. Spontaneous reporting is done by a medically qualified person to a Pharmacovigilance center, where the analysis of the reports are performed [16-18]. The main disadvantage of this approach is the potential for selective reporting and underreporting [19, 20]. Visacri et al., 2015 reported the underreporting of adverse drug reactions and quality deviations monitored by spontaneous reports in Sao Paulo, Brazil [21]. Hazell and Shakir, observed that more than 94% of all ADRs reported by SRS remains unreported [22]. The main cause of underreporting is less awareness among the public and health professionals [23]. This underreporting of ADRs can lead to the false result that a real risk is absent, which is actually present. Selective reporting is another drawback of this system which may give a false impression of a risk that does not exist actually. Thus, even though spontaneous reporting is cheap, it is not the perfect answer to post marketing drug surveillance;but we cannot deny that spontaneous reporting was, and still is, the main way of detecting early drug safety signals. Most of the medicinal products are withdrawn from the market on the basis of SRS, which demonstrates its strength in detecting new safety signals [24, 25].
2.2. Prescription Event Monitoring
Prescription Event Monitoring is a way of recording all the patients exposed to selected drugs. This form of active surveillance was developed in New Zealand (the Intensive Medicines Monitoring Program) and UK (Prescription Event Monitoring) [26, 27]. The patients or their doctors can then be approached by means of a questionnaire to record any or selected events. This type of monitoring is unaffected by the kind of selection and exclusion criteria that characterise clinical trials, thereby eliminating selection bias. This method may detect unexpected benefits of therapy [28]. However, this monitoring has some limitations such as the proportion of adverse effects that go unreported to doctors is unknown.
2.3. Registries
Both types of registries (disease and drug registries) are capable enough to generate safety signals. A Registry is mainly a list of patients, presenting with the same characteristics. Characteristics may be disease (disease registry), or a specific exposure (drug registry). Both types of registries, which only differ by the type of patient data of interest, can collect a lot of information using standardized questionnaires. A disease registry might also be used as a base for a case report study comparing the drug exposure of cases identified from the registry and controls selected from either patients with another condition within the registry or patients outside the registry [29].
2.4. Periodic Safety Update Report (PSUR)
The PSUR can be an important source for the identification of new safety signals. A PSUR is intended to provide an update of the worldwide safety experience of a medicinal product to the Competent Authorities at defined time points post-authorisation. PSURs must be submitted for all registered products, regardless of their marketing status. A single report may cover all products containing the same active substance(s) licensed by one marketing authorisation (MA) holder [30].
2.5. Signal Generation by Trigger Tools
Healthcare providers search for an accurate and reliable method to identify and measure adverse drug reactions in hospitalized patients. The clinical pharmacist is the person who detect early adverse drug reactions and other drug-related problems as well as monitoring the effectiveness of pharmaceuticals by using electronic systems.
2.6. Comparative Observational Studies
2.6.1. Cross- Sectional Study (Survey)
In cross sectional studies, data is collected from a population of patients at a single point of time or interval of time regardless of exposure or disease status. These studies are best to examine the prevalence of a disease at one point of time. Further, these studies are also used to examine the crude association between exposure and outcome in ecological analyses. Cross-sectional studies are utilized best when exposure does not change over time. The major disadvantage of these studies is the indirect assessment of the temporal relationship between exposure and outcome [31].
2.6.2. Case-Control Study
A case control study is a retrospective, descriptive, observational study of a person/disease/outcome in order to determine the type and extent of exposure [32]. These studies are often used to identify factors that may contribute to a medical condition by comparing subjects who have that condition/disease (the "cases") with the patients who do not have the condition/disease (control).
Case control studies are analysed by using the odds ratio, which is an estimate of the relative risk of disease in two groups [33-35]. These studies are useful to investigate, whether there is an association between a drug and one specific rare adverse event, as well as to identify risk factors for adverse events [36]. The results of these studies may be confounded by other factors.
2.6.3. Cohort Study
A cohort study is a prospective, observational study in which group of people having similar characteristics are followed in order to determine the type and extent of exposure [37]. In a cohort study, a population-at-risk for the disease (or event) is followed over a time for the occurrence of the disease. In many of cohort studies involving drug exposure, comparison cohorts of interest are selected on the basis of drug use and followed over time. Cohort studies are useful when there is a need to know the incidence rates of adverse events in addition to the relative risks of adverse events.Cohort studies are also used to examine the safety issues in special populations (the elderly, children, patients, pregnant women) [38]. These studies are analysed by calculating relative risk (disease rate in exposed group/ disease rate in unexposed group). The major drawback of these studies is the time factor (outcome of interest could take time to occur) and effect of confounding variables.
2.7. Anecdotal Reporting
Individual medical practitioners through anecdotal reports provide the majority of the first reports of adverse drug reactions. They describe the occurrence of an event in association with the use of a particular drug. Because of the anecdotal nature, such events need to be verified; however, their confirmation may not be possible [38].
2.8. Meta-Analysis
Meta-analysis is a quantitative, formal, epidemiological study design used systematically to assess previous research studies to derive conclusions about the body of research with the help of statistical methods. Outcomes from a meta-analysis may include a more precise estimate of the effect of treatment or risk factor for disease, or other outcomes, than any individual study contributing to the pooled analysis [39]. In Pharmacovigilance, this analysis aims to establish the association between drugs and adverse events, to estimate the frequency of ADRs, and to identify subgroups at increased risk of ADRs [40].
All the above methods are used to generate a safety signals which are further assessed.
3. SIGNAL ASSESSMENT
The assessment of signals is done in terms of various factors. First, the data in the report(s) need to be of good quality when a signal of a new adverse drug reaction is considered. There should be sufficient data to fully assess the relationship of the drug to the event. Various software and techniques are used for generation of good quality data [41, 42]. Further, for establishing the relationship between cause and effect, various reports have been published but unfortunately there is no universally accepted method for assessing the causality of the ADRs.
3.1. Quality Assessment
The signals with incomplete information that might make the causality assessment impossible or of no use are excluded. The subjective assessment of the quality of the reports is mainly based on the patient and drug information. Patient information includes completeness of information with- patient initials, age, sex, date of birth (DOB), weight, diagnosis for which the medications were being taken, relevant history, adverse event description, adequate description of the event, when did the event occur? When did the event subside? How the event was managed? What was the outcome? Whether the event abated on stopping the drug or reducing the dose of the drug? Whether the event reappeared on reintroduction? Any supportive laboratory data? Drug information includes suspected medication with their brand name and/or generic name, labelled strength, manufacture, dose used, frequency of use, route used and therapy dates, concomitant medications including self-medication and herbal remedies etc.
3.2. Seriousness of Adverse Event
The seriousness of the event is detected from the description of the event and the information provided in the relevant portion of the ADR forms. Adverse events are regarded as serious if they were fatal (if the death was an outcome of the adverse event), life-threatening (if the patient was at substantial risk of dying at the time of the adverse event), caused significant disability or incapacitation (if the adverse event resulted in a substantial disruption of a person's ability to conduct normal life functions), caused or prolonged hospitalization (if admission in the hospital or prolongation of hospitalization was due to the adverse event), or required intervention to prevent any of these outcomes or led to congenital anomalies (if exposure to a medical product prior to conception or during pregnancy may have resulted in an adverse outcome in the child).
3.3. Coding of Adverse Drug Reactions
Medical coding is the process of transforming descriptions of ADRs into universal medical terms with the help of drug dictionaries such as Med DRA, WHO-ART, WHO-DDE, CONSTART, ICD9 CM. Med DRA is clinically validated international medical terminology use by the regulatory authorities and the regulated bio pharmaceutical industries throughout the entire regulatory process, from pre- marketing to post-marketing activities & for data entry, retrieval, evaluation & presentation. WHO-ART (World Health Organization adverse reactions terminology) is maintained by UMC and is used for coding clinical information in relation to the drug therapy. WHO-DDE (World Health Organization Drug-Dictionary Enhanced)is used for the classification of drugs providing proprietary and non-proprietary names of medical products used in different countries, together with all active ingredients. COSTART (Coding symbols for thesaurus of adverse reactions terms) was developed by the United States Food and Drug Administration (FDA) for the coding, filing and retrieving of post-marketing adverse reaction reports. ICD9CM (International classification of diseases 9-revision clinical modification) is also used for coding of ADRs [43, 44].
3.4. Collation
3.4.1. Vigiflow (India)
VigiFlow is a web-based Individual Case Safety Report (ICSR) management system that is specially designed for use by national centres in the WHO Programme for International Drug Monitoring [45]. It can also be used by pharmaceutical companies or clinical research organisations for monitoring of their ICSR. Vigi Flow is based on and compliant with the ICH E2B standard and is a trademark of the UMC and maintained by the UMC in Uppsala, Sweden (Table 1). VIGIBASE is the name of the WHO global ICSR database measure (IC value) stratified in different way and useful filter capabilities. It has been in use for more than 30 years. It is located in Uppsala since 1978 and designed for spontaneous reports, maintained by the UMC [46].
Country wise data bases and adverse drug reaction (ADR) form.
| Country | Regulatory agency | Data base | ADR forms |
|---|---|---|---|
| USA | FDA | Aers | Med Watch |
| Europe | EMEA | Eudravigilance | - |
| UK | MHRA | - | Yellow Card |
| India | CDSCO | Vigiflow | Suspected Adverse Drug Reaction Forms |
| Japan | PMDA | - | - |
| Australia | TGA | - | Blue Card |
| Singapore | HAS | - | ADR Watch |
| Canada | HC | Canada Vigilance | Canada Vigilance Repoting Form |
| Malaysia | NPCB | - | - |
| Saudi Arabia | SFDA | - | - |
| Brazil | ANVISA | - | - |
| China | SFDA | - | - |
FDA: Food and Drug Administration; EMEA: European Medicines Agency; MHRA: Medicines and Healthcare Products Regulatory Agency; CDSCO: Central Drugs Standard Control Organization; PMDA: Pharmaceuticals and Medical Devices Agency; TGA: Therapeutic Goods Administration; HAS: Health Sciences Authority; HC: Health Canada; NPCB: National Pharmaceutical Control Bureau; SFDA: Saudi Food and Drug Authority; ANVISA: National Health Surveillance Agency Brazil; SFDA: State Food and Drug Administration.
WHO-UMC causality categories .
| Causality term | Assessment criteria |
|---|---|
| Certain | Event or laboratory test abnormality, with plausible time relationship to drug intake • Cannot be explained by disease or other drugs • Response to withdrawal plausible (pharmacologically, pathologically) • Event definitive pharmacologically or phenomenologically (i.e. an objective and specific medical disorder or a recognised pharmacological phenomenon) • Rechallenge satisfactory, if necessary |
| Probable/Likely | • Event or laboratory test abnormality, with reasonable time relationship to drug intake • Unlikely to be attributed to disease or other drugs • Response to withdrawal clinically reasonable • Rechallenge not required |
| Possible | • Event or laboratory test abnormality, with reasonable time relationship to drug intake • Could also be explained by disease or other drugs • Information on drug withdrawal may be lacking or unclear |
| Unlikely | • Event or laboratory test abnormality, with a time to drug intake that makes a relationship improbable (but not impossible) • Disease or other drugs provide plausible explanations |
Naranjo’s classification criteria.
| Question | Yes | No | Do not know |
|---|---|---|---|
| Are there previous conclusion reports on this reaction? | +1 | 0 | 0 |
| Did the adverse event appear after the suspect drug was administered? | +2 | –1 | 0 |
| Did the adverse reaction improve when the drug was discontinued or a specific antagonist was administered? | +1 | 0 | 0 |
| Did the adverse reaction reappear when drug was re-administered? | +2 | –1 | 0 |
| Are there alternate causes [other than the drug] that could solely have caused the reaction? | –1 | +2 | 0 |
| Did the reaction reappear when a placebo was given? | –1 | +1 | 0 |
| Was the drug detected in the blood [or other fluids] in a concentration known to be toxic? | +1 | 0 | 0 |
| Was the reaction more severe when the dose was increased or less severe when the dose was decreased? | +1 | 0 | 0 |
| Did the patient have a similar reaction to the same or similar drugs in any previous exposure? | +1 | 0 | 0 |
| Was the adverse event confirmed by objective evidence? | +1 | 0 | 0 |
Scoring for Naranjo algorithm: >9 = definite ADR; 5–8 = probable ADR; 1–4 = possible ADR; 0 = doubtful ADR.
3.4.2. AERS (USA) (Adverse Event Reporting System)
The Adverse Event Reporting System (AERS) is a database that contains information on adverse event and medication error reports submitted to FDA as shown in Table 1. The database is designed to support the FDA's post-marketing safety surveillance program for drug and therapeutic biologic products. The informatics structure of the AERS database adheres to the international safety reporting guidance issued by the International Conference on Harmonisation (ICHE2B). Adverse events and medication errors are coded in terms in the Med DRA terminology.
AERS is a useful tool for FDA for activities such as looking for new safety concerns that might be related to a marketed product, evaluating a manufacturer's compliance to reporting regulations and responding to outside requests for information. The reports in AERS are evaluated by clinical reviewers in the Center for Drug Evaluation and Research (CDER) and the Center for Biologics Evaluation and Research (CBER) to monitor the safety of products after they are approved by FDA. If a potential safety concern is identified in AERS, further evaluation is performed.
3.4.3. Eudravigilance (Europe)
Eudra Vigilance (European Union Drug Regulating Authorities Pharmacovigilance) is the European data processing network and management system for reporting and evaluation of suspected adverse reactions during the development of new drugs and for following the marketing authorisation of medicinal products in European Economic Area (EEA) as shown in Table 1. The European Eudra Vigilance system deals with the Electronic exchange of Individual Case Safety Reports (ICSR, based on the ICH E2BM specifications) [47].
3.4.4. Canada Vigilance (Canada)
Canada Vigilance Adverse Reaction Online Database, contains information about adverse reactions that have occurred in Canada (Table 1). The Database is updated quarterly to reflect new information received by Health Canada. Information contained in the Canada Vigilance Adverse Reaction Online Database uses generic terminology that excludes any identifiers relating to the patient and/or reporter. Features of the Canada Vigilance Adverse Reaction Online Database includes search capacity by brand name, active ingredient name, adverse reaction terms or system organ class, help documentation and background information, capacity to print/save/export search results [48].
3.4.5. Argus Safety Database
The Argus safety database is a key part of Argus safety 3.0.1 pharmacovigilance software system. The digital database is used to help the companies to ensure compliance with global regulations regarding pharmacovigilance and other related activities. As a comprehensive pharmaceutical software system, it supports a Pharmacovigilance business process that takes place in both the pre and post marketing phase of the drug. The Argus database is hosted in a data center that is ISO-9001 certified and operated according to
the security standard promulgated by the FDA guidelines. Related products: Oracle Argus Safety, Oracle Argus Safety Japan, Oracle Argus Insight, Oracle Argus Perceptive, Oracle Argus Affiliate, Oracle Argus Dossier, Oracle Argus Interchange, Oracle Argus Reconciliation, Oracle Argus Unblinding [49].
3.4.6. Aris-g Software
ARIS-g is the world's leading pharmacovigilance and clinical safety system, with more than 300 companies maintaining their critical drug safety data in ARISg worldwide. ARISg provides all the functionality required to manage adverse event reporting and adverse reaction requirements of different authorities around the world, from case entry to automatic generation of submission ready adverse event (AE) reports including CIOMS I, Med Watch 3500A and many more [50].
3.4.7. GATEpatni
iGATE offers a Clinical Trials Dashboard that helps sponsors monitor status and progress of the clinical trial in terms of safety and efficacy of investigational drug [51].
4. CAUSE AND EFFECT ANALYSIS
Currently there’s no universally accepted method for assessing causality of ADRs. Several methods that can be used to make a causality assessment of ADR reports are: the literature (9 points of consideration – Morges, Switzerland, 1981), Probability calculation (Bayes’ Theorem). Aetiological – Diagnostic Systems (Bénchiou’s group method), French imputation systems, the European ABO Systems, the US Reasonable Possibility Systems, the Naranjo’’s ADR Probability Scale, WHO Causality Categories, Jones' algorithm, Yale algorithm, Karch and Lasagna algorithm, Begaud algorithm, Newer quantitative approach algorithm, Venulet' algorithm, Emanuelli' algorithm, Gallagher' algorithm and Kramer' algorithm. Of all these methods, the most commonly used methods are WHO-UMC causality categories and Naranjo’s Probability Scale.
4.1. WHO-UMC Causality Assessment System
The WHO-UMC system has been developed in consultation with the National Centers participating in the program for International Drug Monitoring and is meant as a practical tool for the assessment of case reports. It is basically a combined assessment taking into account the clinical--pharmacological aspects of the case history and the quality of the documentation of the observation with less prominent role of other criterias such as previous knowledge and statistical chance in the system. It is recognized that the semantics of the definitions are critical and that individual judgements may therefore differ. This method gives guidance to the general arguments which should be used to select one category over another as shown in Table 2. a) CERTAIN:- A clinical event, including laboratory test abnormality occurring in a plausible time relationship to a drug administration, and which can’t be explained by concurrent disease or other drugs or chemicals. The response to withdrawal of the drug (dechallenge) should be clinically plausible. The event must be definitive pharmacologically or phenomenologically, using a satisfactory rechallenge procedure if necessary. b) PROBABLE/LIKELY:- A clinical event, including laboratory test abnormality, with a reasonable time sequence to administration of drugs, unlikely to be attributed to concurrent disease or other drugs or chemicals, and which follows a clinically reasonable response on withdrawn (dechallenge). c) POSSIBLE:- A clinical event, including laboratory test
abnormality, with a reasonable time sequence of administration of the drug, but which could also be explained by concurrent disease or other drugs or chemicals. Information on drug withdrawal may be lacking or unclear. d) UNLIKELY:-A clinical event, including laboratory test abnormality, with a temporal relationship to drug administration, which makes a causal relationship improbable and in which other drugs, chemicals or underlying disease provide plausible explanation [52].
4.2. Naranjo’s Probability Scale
Naranjo’s probability scale is the most commonly used causality assessment method, which has gained popularity among clinicians because of its simplicity. It is a structured, transparent, consistent and easy to apply assessment method. The Naranjo’s criteria classifies the probability that an adverse event is related to the drug therapy based on a list of weighted questions, which examine factors such as the temporal association of drug administration and event occurrence, alternative causes for the event, drug levels, dose – response relationships and previous patient experience with the medication. The ADR is assigned to a probability category from the total score as follows: definite if the overall score is 9 or greater, probable for a score of 5-8, possible for 1-4 and doubtful if the score is 0 as shown in Table 3. The Naranjo’s criteria do not take into account drug-drug interactions. Drugs are evaluated individually for causality, and points are deducted if another factor may have resulted in the adverse event, thereby weakening the causal association [53].
The Naranjo Scale was originally developed to assess the drug and its ADRs analysis at therapeutic dose. It has not been validated for use in patients that are critically ill, suffer specific organ toxicity or overdose. Application of the Naranjo Scale in the overdose setting is not scientifically valid.
5. RECENT METHODOLOGICAL DEVELOPMENTS
Recently, the risk management plans (RMPs), are introduced in the post marketing surveillance in order to identify, characterize, prevent or minimize risk relating to medicinal products, including the assessment of the effectiveness of intervention. These RMPs can provide better understanding of benefits-risks of the drug during post authorization period [54].
Transparency is important for the pharmacovigilance [55, 56]. It has been increased in the last few years. In 2005, the International Committee of Medical Journal Editors (ICMJE) initiated a policy requiring investigators to deposit information about trial design into an accepted clinical trials registry before the onset of patient enrollment [57]. Most of the countries, including Canada (http://www.hc-sc.gc.ca), the Netherlands (http://www.lareb.nl) and the UK (http://www.mhra.gov.uk), have made their databases (containing the safety data) freely available to the public. The quality of information in adverse event reports submitted by health professionals plays a key role in detecting signals of adverse events. The increased use of electronic submission increases the quality of adverse event reports [58].
Another most important development is involvement of patients in pharmacovigilance. Now, in most of the countries, patients are allowed to report ADRs to the spontaneous reporting system [59]. The Netherlands Pharmacovigilance Centre Lab, in 2006, introduced an intensive monitoring programme using patients as a source of information. Patients can register at the LIM website, and after some period of time they receive questionnaires asking them about the adverse events. The system is totally web based; questionnaires can be sent via email. This type of automation allows a rapid collection and analysis of data.
6. FUTURE PERSPECTIVES
In order to further prove Pharmacogilance as a science, it is essential that the academia develops new methods which can strengthen the current system. Active surveillance is necessary to receive information about the safety of the drugs at an early stage. When developing new methods for active post-marketing surveillance, one has to bear in mind the importance of being able to gather information in a timely manner. Furthermore, when facing an ADR, a question that patients as well as the treating physician can ask is: How much strong is a causal relationship between the drug exposure and its outcomes? None of the main methods which are being used today in post marketing surveillance can provide a proper answer to this question. Most of the methods, results are contradictory with each other. It is therefore important to develop methods which are able to sort out these type of questions.
The role of patients is gradually changing. Now, the patient is highly informed about his disease and also wants to participate actively in his treatment. So, for the future Pharmacovigilance has to concentrate on this group as a major source of information. The Pharmacovigilance of tomorrow must be able to identify new safety signals without delay. If we succeed herein, the patient’s confidence in drugs will return.
CONCLUSION
The proper signal detection and their assessment is the most important aspect in pharmacovigilance. Various methods are used for the detection of signals. Signals in pharmaco-vigilance have a variety of sources. Pharmacovigilance may not rely upon one single method, but needs a strategy of complementary activities. The quality of the reports can be increased through proper training and re-training of the personnel engaged in the pharmacovigilance activity. No single causality assessment method is universally acceptable. Therefore a single universally acceptable efficient method is the demand of the time.
CONFLICT OF INTEREST
The authors confirm that this article content has no conflict of interest.
ACKNOWLEDGEMENTS
Author Anoop Kumar, gratefully acknowledges the Department of Science and Technology (DST), New Delhi, India for providing the financial assistance in the form of a DST-INSPIRE fellowship (IF 120789).